Chart
Charts can be used to summarize the data in visual format. It helps to present data as bars, areas, lines and many other forms. To present the data, choose the appropriate chart type; it will determine how well the data can be interpreted while visualizing it in the chart form.
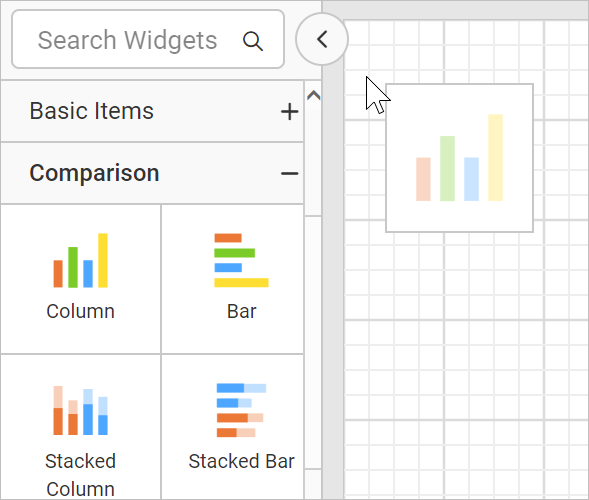
Add chart to the report
To add a Chart data region to the report, drag and drop the chart type of your choice from the item panel into design area.
Now, the chart item will be rendered in the design area and the chart properties will be listed in properties panel.
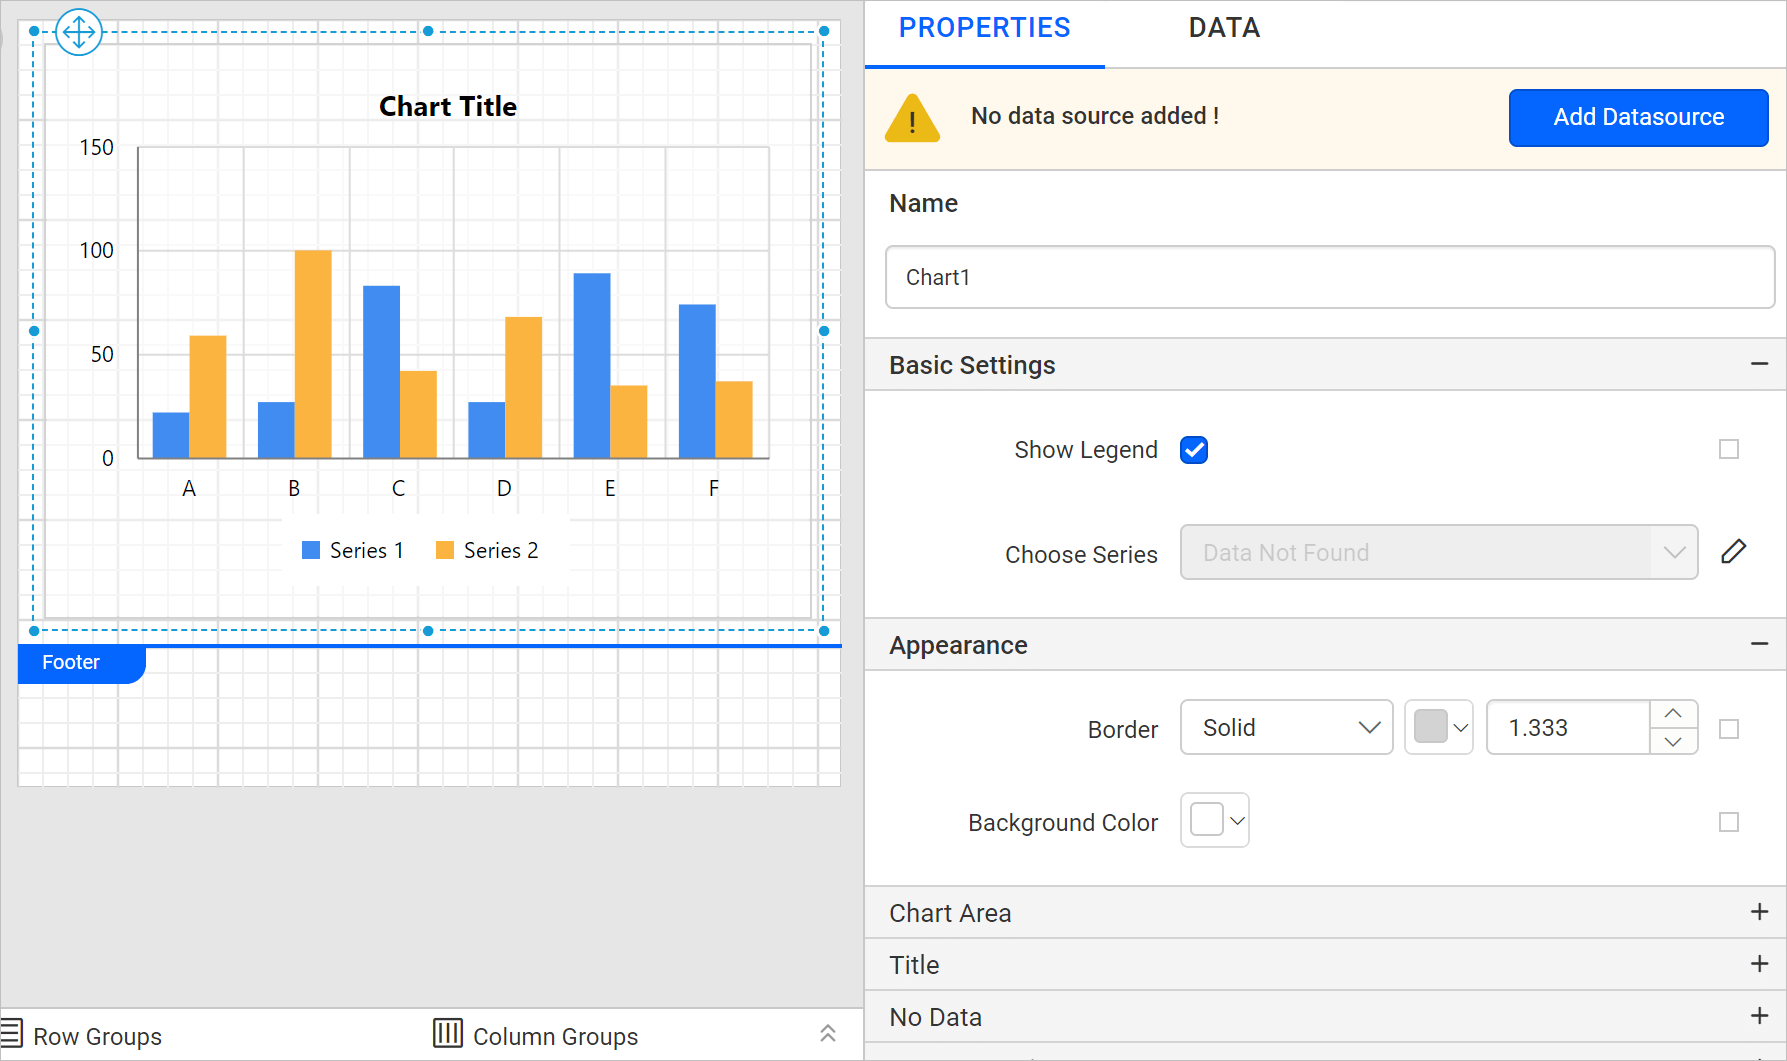
Configure data and format the chart to visualize the data.
Here, Column chart type is used for demonstration.
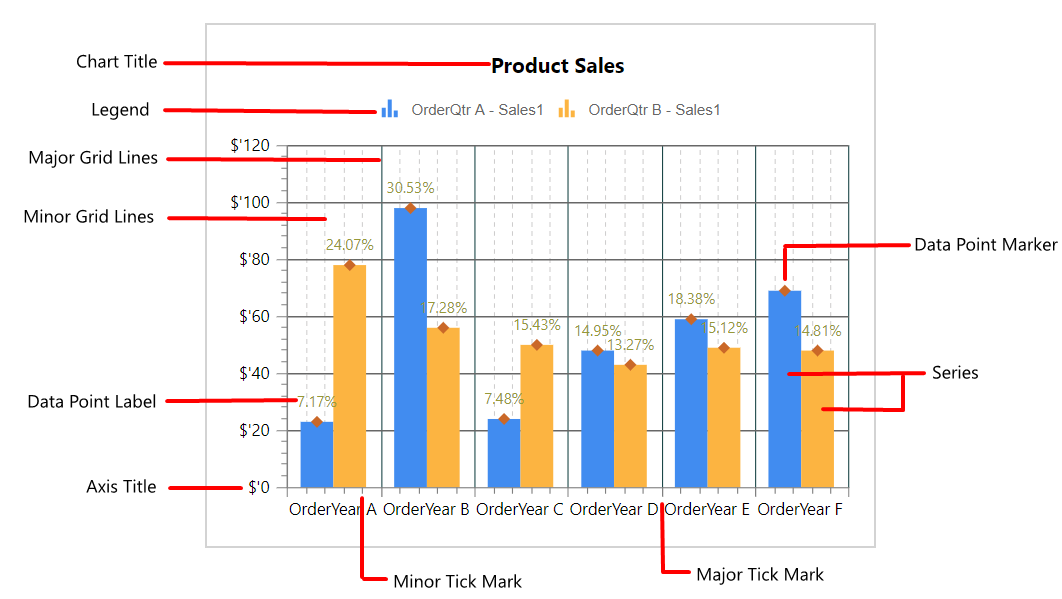
Chart parts
The following snap shows the different elements used in the chart.