How to Configure Tablix with Multiple Datasets
This section explains how to configure the tablix with multiple datasets. In Report Designer, the enableTableMultipleDataAssign client-side API allows you to configure data from multiple datasets into a Tablix.
Create report designer javascript application
Refer to the Getting started to create a Report Designer JavaScript application.
Set the enableTableMultipleDataAssign API
During the initialization of the Report Designer control, set the enableTableMultipleDataAssign property to True. When this property is enabled, you can bind data from multiple datasets to a Tablix. The dataset assigned in the Dataset Property of tablix is bound to tablix, while fields from other datasets are considered as expression.
Add the following code within the <body> tag of the web Report Designer HTML page.
<!-- Creating a div tag which will act as a container for boldReportDesigner widget.-->
<div style="height: 600px; width: 950px; min-height: 400px;" id="designer"></div>
<script type="text/javascript">
$(function () {
$("#designer").boldReportDesigner({
serviceUrl: "https://demos.boldreports.com/services/api/ReportingAPI",
enableTableMultipleDataAssign: true
});
});
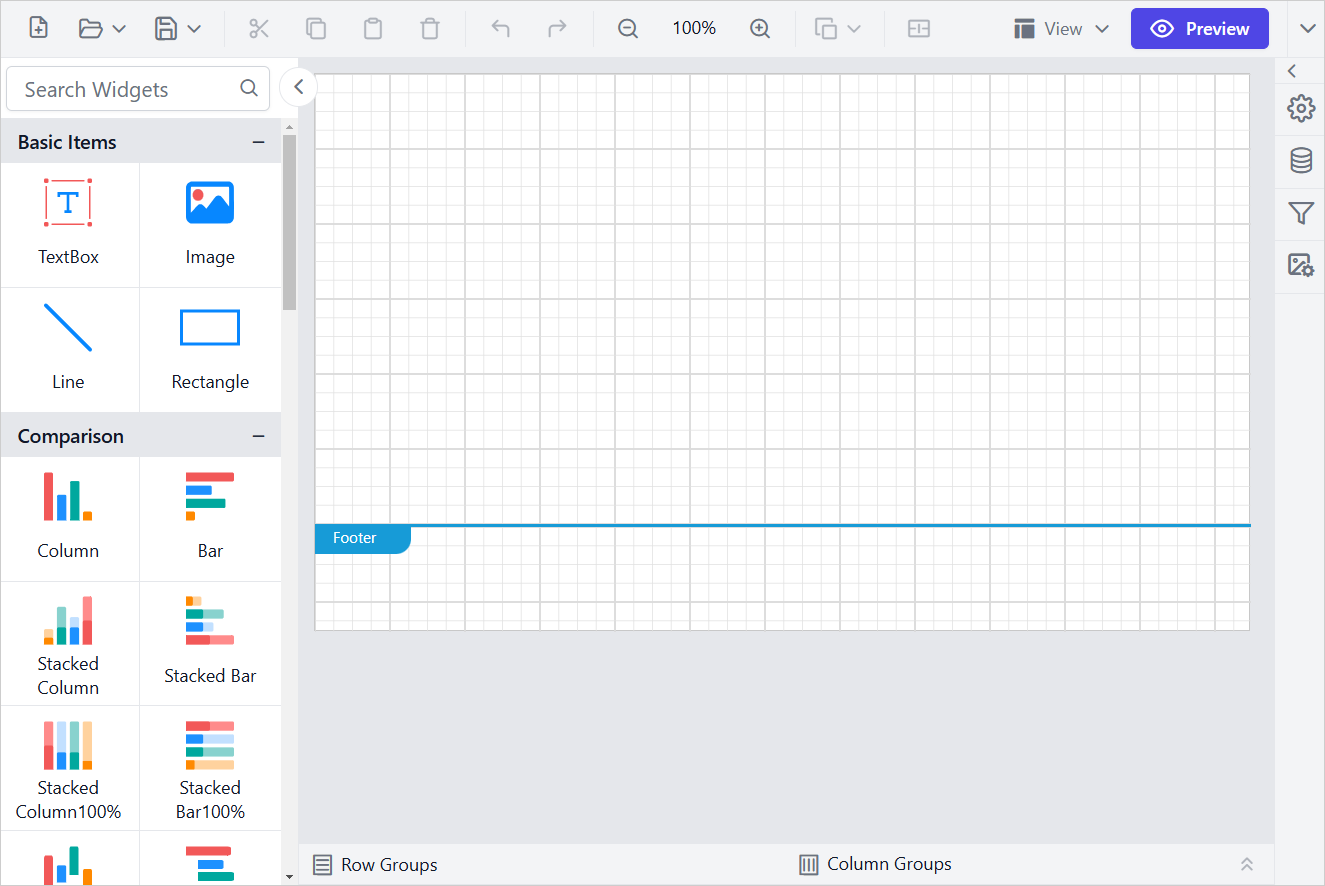
</script>Once you run the application, the report designer will render as shown below:
Create dataset
Refer to the Create Data section to create multiple datasets in the report. In this design section, AdventuresWorks database is used.
Add a table to the report
- The table report item is listed in the item panel under the
Data Regionscategory.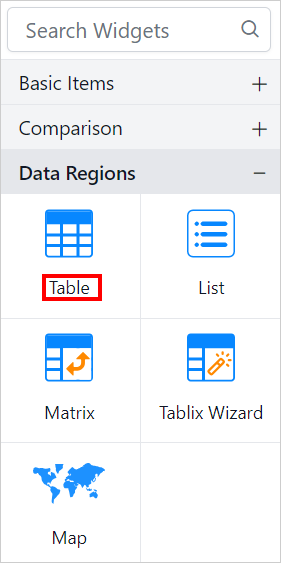
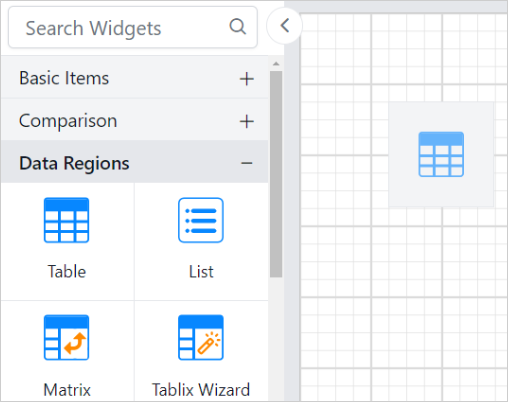
- Drag and drop the table report item into the design area from the item panel.
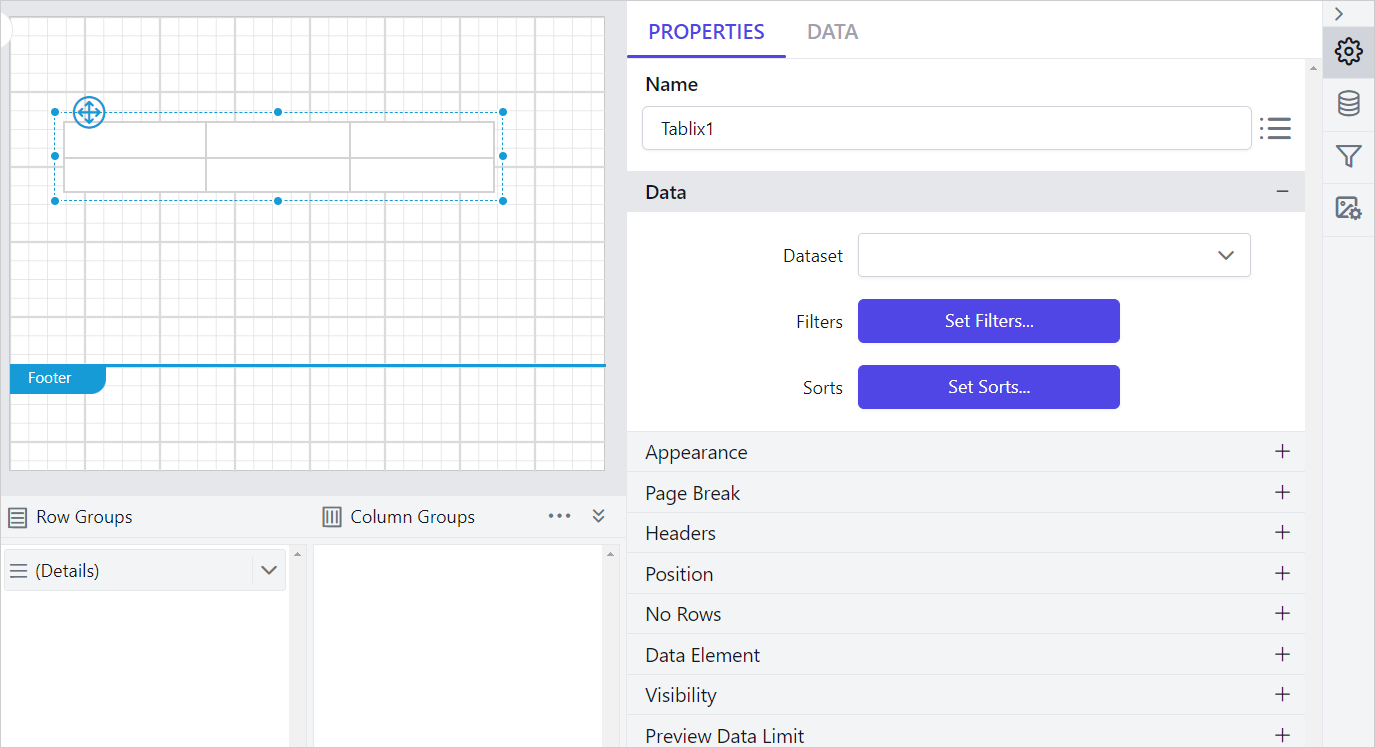
- The respective table properties will be displayed in the properties panel.
Assign data to the tablix
-
Select any cell within the Tablix data region. Click on the
Data assignmenu icon to open data assign menu.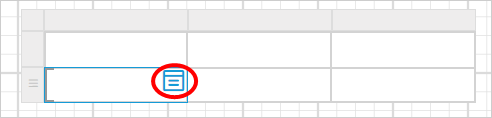
-
The available datasets in the report will be displayed in the dropdown menu of the data assign menu.
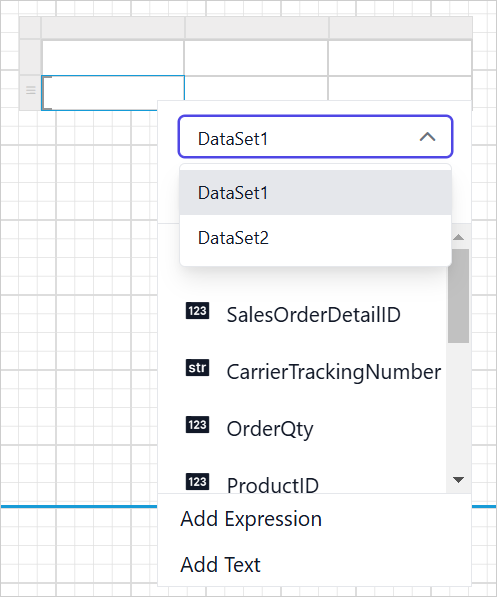
-
Select the fields
SalesOrderID,ModifiedDate, andOrderQtyfromDataSet1. The selected fields will be assigned to the corresponding cells, as shown below.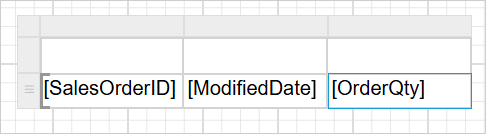
-
Now, choose
Dataset2from the dropdown menu; the respective fields will be listed below.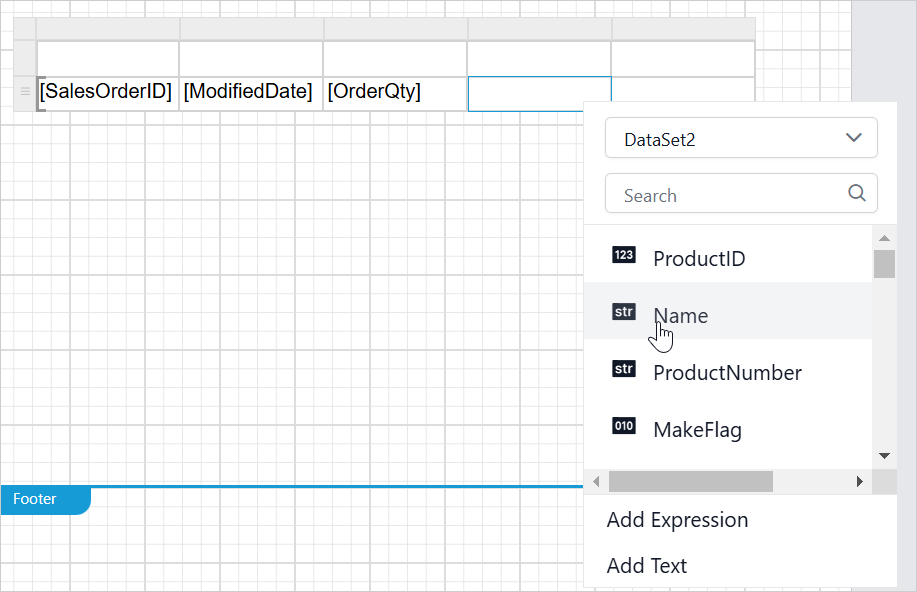
-
The fields
NameandUnitPriceassigned fromDataSet2will be considered as expressions.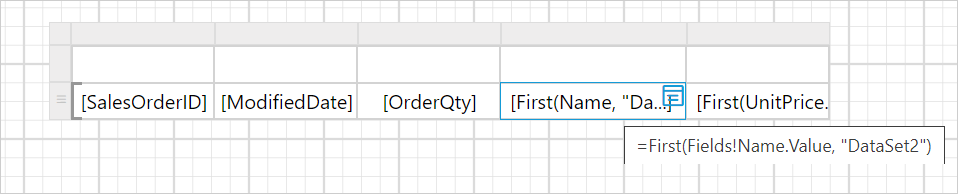
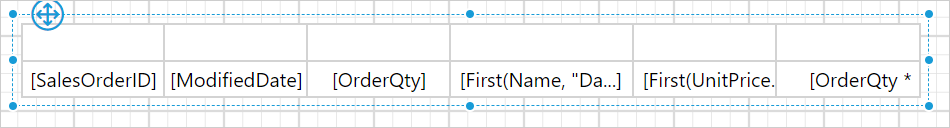
Calculate a item total
To calculate the item total, refer to the Assign expression in cell section and assign the following expression to the last cell: =Fields!OrderQty.Value * First(Fields!UnitPrice.Value, "DataSet2").
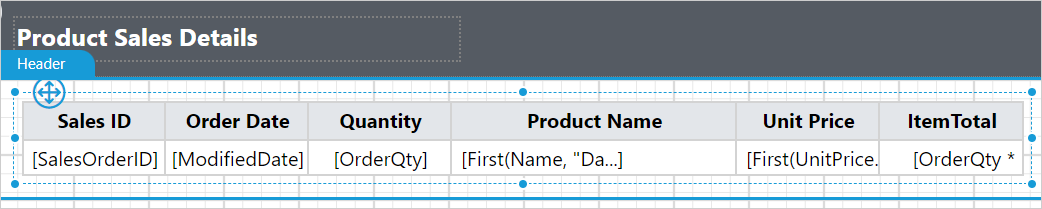
Format tablix design
In the design below, the background color and font styles in the Tablix cells have been updated to enhance the report design.
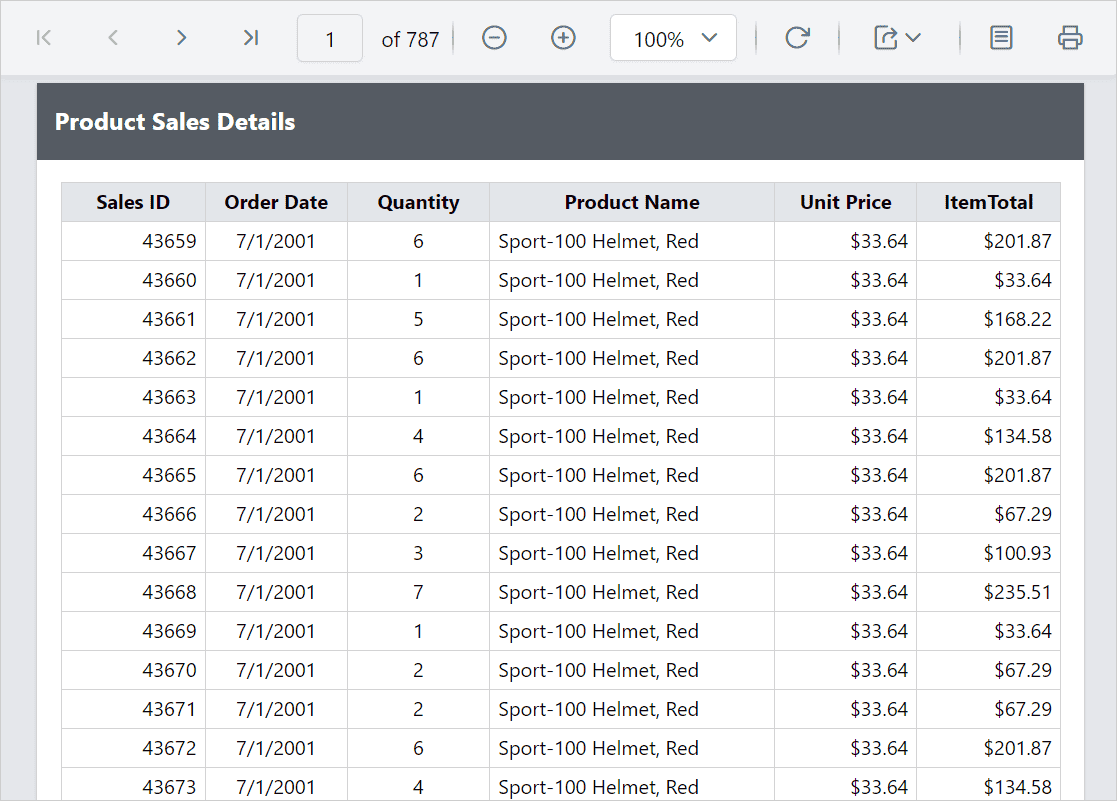
Report preview
In the report preview, the Product Sales Report will be displayed as shown below:
Download the above report design from this link.