How to use Bold Reports® Report Viewer in java application with Tomcat server
This article provides details on how to use Bold Reports® Report Viewer in a Java application with a Tomcat server.
Prerequisites
- Eclipse IDE
- Tomcat Server
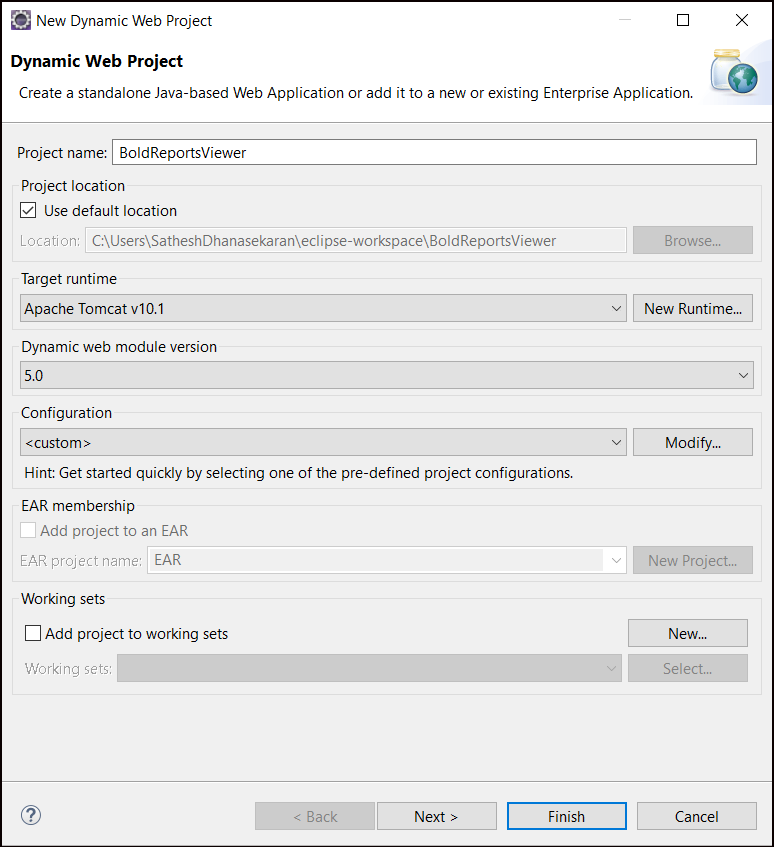
Create a new Dynamic Web Project in Eclipse
- Open Eclipse and go to File > New > Dynamic Web Project.
- Enter a name for your project and click Next.
- Select the Target Runtime as Tomcat and Dynamic web module version. Click Next.
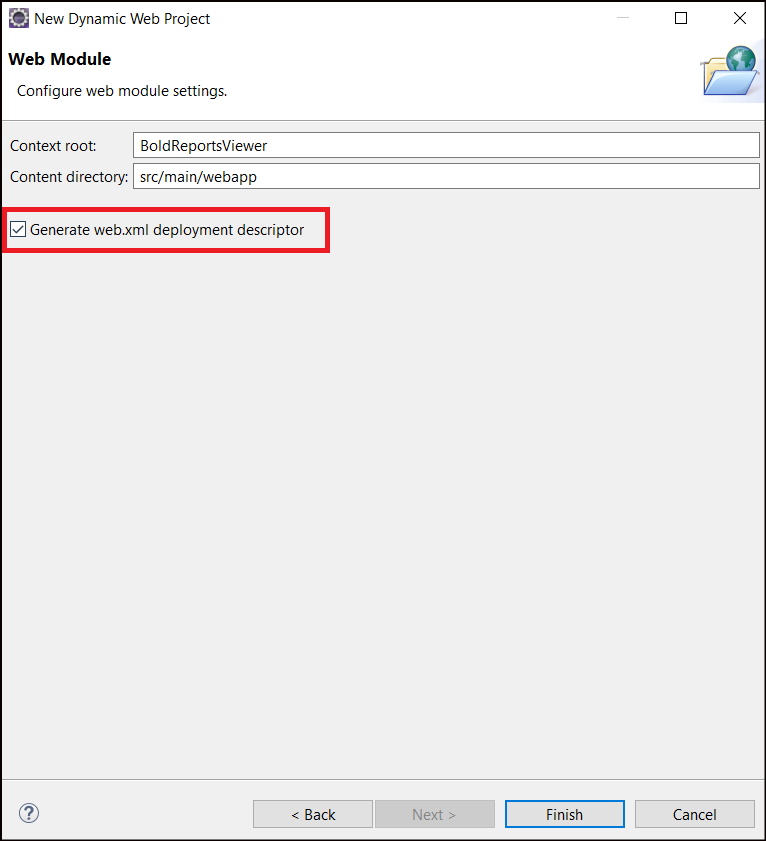
- In the Web Module, enable Generate
web.xmldeployment descriptor.
JSP file creation
In the Eclipse project explorer, right-click on the web app folder and select New > JSP file.
<!DOCTYPE html>
<html xmlns="http://www.w3.org/1999/xhtml">
    <head>
        <title>Report Viewer first HTML page</title>
    </head>
    <body>
    </body>
</html>
Refer scripts and CSS
Directly refer to all the required scripts and style sheets from the CDN links that are mandatorily required to use the Report Viewer, in the following order.
bold.reports.all.min.cssjquery.min.jsej2-base.min.js,ej2-data.min.js,ej2-pdf-export.min.js,ej2-svg-base.min.js,ej2-lineargauge.min.js, andej2-circulargauge.min.js- Renders the gauge item. Add these scripts only if your report contains the gauge report item.ej2-maps.min.js- Renders the map item. Add this script only if your report contains the map report item.bold.reports.common.min.jsbold.reports.widgets.min.jsej.chart.min.js- Renders the chart item. Add this script only if your report contains the chart report item.bold.report-viewer.min.js
Refer to the Bold Reports® CDN to learn more details about the Bold Reports® CDN scripts and style sheet links.
You can replace the following code in the <head> tag of the Report Viewer HTML page.
<link href="https://cdn.boldreports.com/12.2.6/content/material/bold.reports.all.min.css" rel="stylesheet" />
<script src="https://cdnjs.cloudflare.com/ajax/libs/jquery/3.6.0/jquery.min.js"></script>

<!--Render the gauge item. Add this script only if your report contains the gauge report item. -->
<script src="https://cdn.boldreports.com/12.2.6/scripts/common/ej2-base.min.js"></script>
<script src="https://cdn.boldreports.com/12.2.6/scripts/common/ej2-data.min.js"></script>
<script src="https://cdn.boldreports.com/12.2.6/scripts/common/ej2-pdf-export.min.js"></script>
<script src="https://cdn.boldreports.com/12.2.6/scripts/common/ej2-svg-base.min.js"></script>
<script src="https://cdn.boldreports.com/12.2.6/scripts/data-visualization/ej2-lineargauge.min.js"></script>
<script src="https://cdn.boldreports.com/12.2.6/scripts/data-visualization/ej2-circulargauge.min.js"></script>

<!--Render the map item. Add this script only if your report contains the map report item.-->
<script src="https://cdn.boldreports.com/12.2.6/scripts/data-visualization/ej2-maps.min.js"></script>

<!-- Report Viewer component script-->
<script src="https://cdn.boldreports.com/12.2.6/scripts/common/bold.reports.common.min.js"></script>
<script src="https://cdn.boldreports.com/12.2.6/scripts/common/bold.reports.widgets.min.js"></script>

<!--Render the chart item. Add this script only if your report contains the chart report item.-->
<script src="https://cdn.boldreports.com/12.2.6/scripts/data-visualization/ej.chart.min.js"></script>
<script src="https://cdn.boldreports.com/12.2.6/scripts/bold.report-viewer.min.js"></script>
To learn more about rendering a report with data visualization report items, refer to the how to render data visualization report items section.
Adding Report Viewer Widget
Add the <div> element within the <body> section, which acts as a container for the boldReportViewer widget to render, and then initialize the boldReportViewer widget within the script section as shown in the following.
<div style="height: 600px; width: 950px;">
    <!-- Creating a div tag which will act as a container for boldReportViewer widget.-->
    <div style="height: 600px; width: 950px; min-height: 400px;" id="viewer"></div>
    <!-- Setting property and initializing boldReportViewer widget.-->
    <script type="text/javascript">
        $(function () {
            $("#viewer").boldReportViewer();
        });
    </script>
</div>
Create Web API service
The Report Viewer requires a Web API service to process the report files. You can skip this step and use the online Web API services to preview the already available reports, or you should create any one of the following Web API services:
Adding already created report
If you have created a new service, add the reports from the Bold Reports® installation location. Refer to the samples and demos section for more information.
-
Create a folder
Resourcesin your Web API application to store RDL reports and add the already created reports to it. -
Add the already created reports to the newly created folder.
In this tutorial, the
sales-order-detail.rdlreport is used, and it can be downloaded at this link.
To create a new report refer to the create RDL report section.
Set report path and Web API service
To render the reports available in your application, set the reportPath and reportServiceUrl properties of the Report Viewer.
<div style="height: 600px; width: 950px;">
    <!-- Creating a div tag which will act as a container for boldReportViewer widget.-->
    <div style="height: 600px; width: 950px; min-height: 400px;" id="viewer"></div>
    <!-- Setting property and initializing boldReportViewer widget.-->
    <%
    String reportServiceUrl = (String) application.getAttribute("reportServiceUrl");
    String reportPath = (String) application.getAttribute("reportPath");
    %>
   <script type="text/javascript">
    $(function () {
      $("#viewer").boldReportViewer({
        reportServiceUrl: "<%=reportServiceUrl%>",
        reportPath: "<%=reportPath%>"
     });
    });
   </script>
</div>
In the above code, the
reportServiceUrlis used from the online URL. You can host the Bold Reports® service at any Azure, AWS, or own domain URL and use it in the Report Viewer. You can view the already created Web API service from the Reporting Service git hub location.
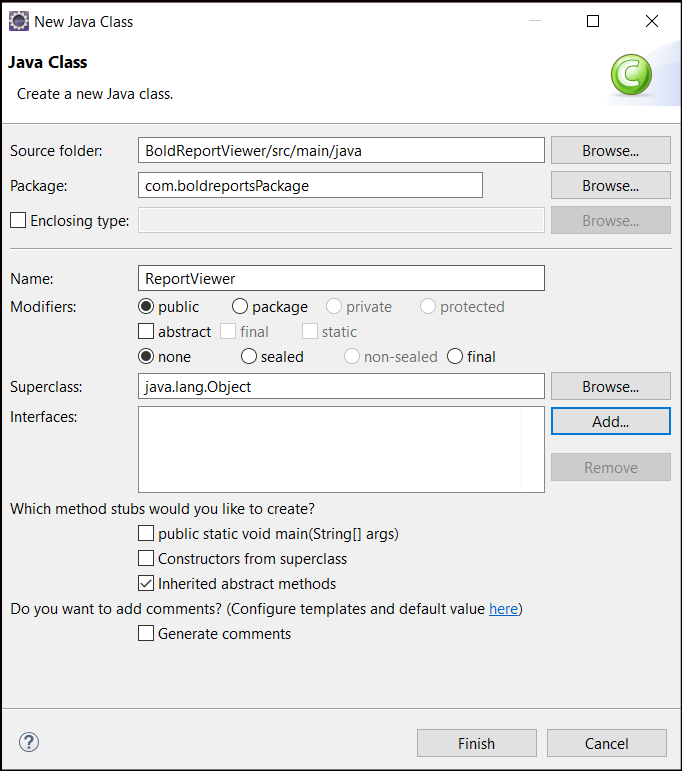
Create a new Java class for setting up the Bold Report Viewer
- In the Eclipse project explorer, right-click on the src folder and select New > Class.
- Enter the package and name the class and click Finish.
- This class sets up the context attributes for the ReportViewer
Servlet.
package com.sample;
import jakarta.servlet.ServletContext;
import jakarta.servlet.ServletContextEvent;
import jakarta.servlet.ServletContextListener;

public class passingservlet implements ServletContextListener {

    @Override
    public void contextInitialized(ServletContextEvent event) {
        // Set the context attribute.
        ServletContext context = event.getServletContext();
        String reportServiceUrl = "https://demos.boldreports.com/services/api/ReportViewer";
        String reportPath = "~/Resources/docs/sales-order-detail.rdl";
        context.setAttribute("reportServiceUrl", reportServiceUrl );
        context.setAttribute("reportPath", reportPath);
    }
}- Map the ReportViewer class to the application context on the
web.xmlfile.
<?xml version="1.0" encoding="UTF-8"?>
<web-app>
 <listener>
  <listener-class>com.boldreportPackage</listener-class>
 </listener>
</web-app>- Run the application and select the server to run, then Finish.
Congratulations, Now you can use the Bold Reports® Report Viewer in the Java application with the Tomcat server.