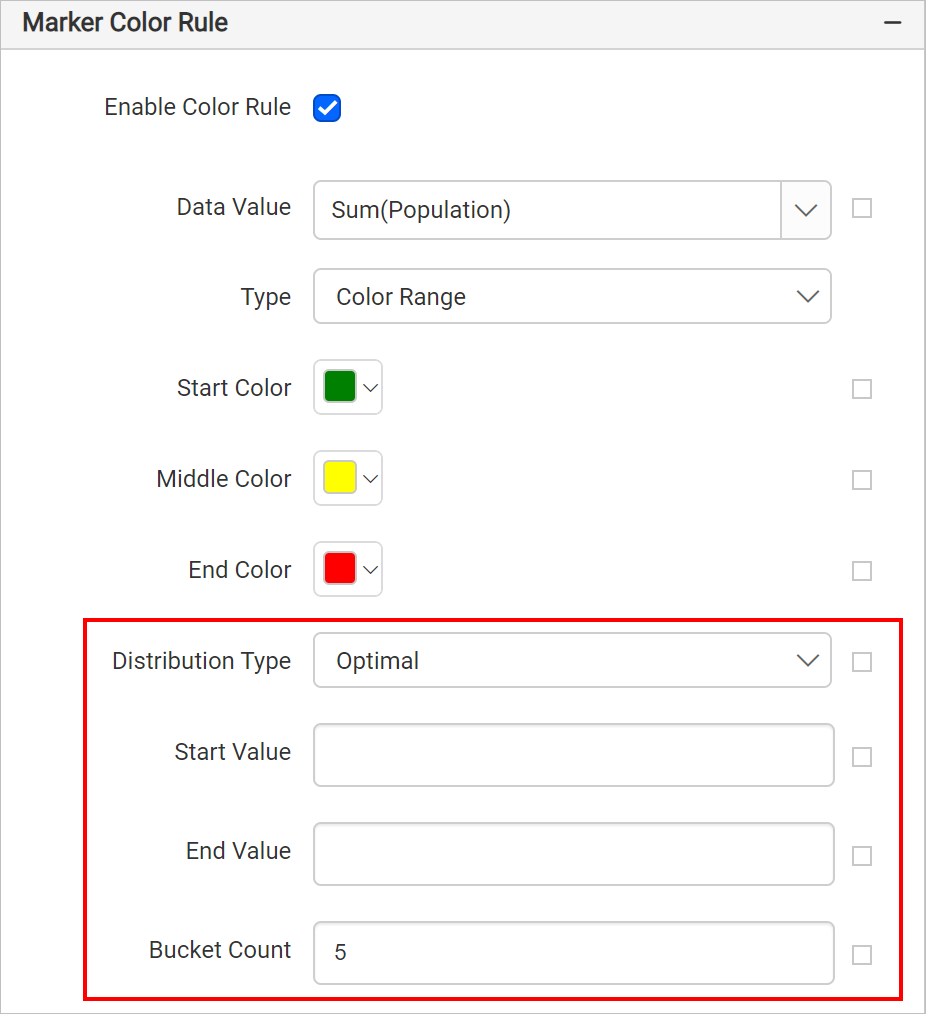
Optimal Distribution
This distribution type adjusts the size of data intervals so as to limit the grouping blunder and in this manner the map looks increasingly adjusted and the outcomes appear to be progressively right, with only a couple of shapes in the highest class as one would anticipate.
Once you select the data value, the properties required to configure distribution type will start displaying under marker color rule category,
You can also apply distribution type based on dynamic values, by using the Expressions. Refer Set Expressions and Reset Expressions section to open set/reset expression menu in properties panel.
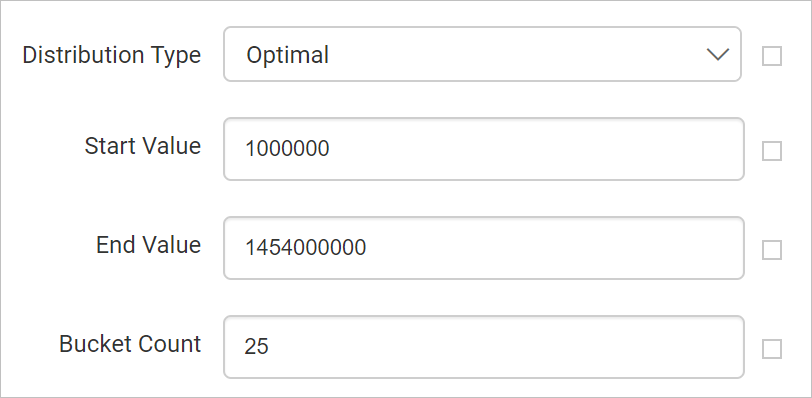
Start and end value
Based on start and end values the ranges will be split using an algorithm in report preview.
For example, to display population of each country on a map, you can set minimum population as start value and maximum population as end value.
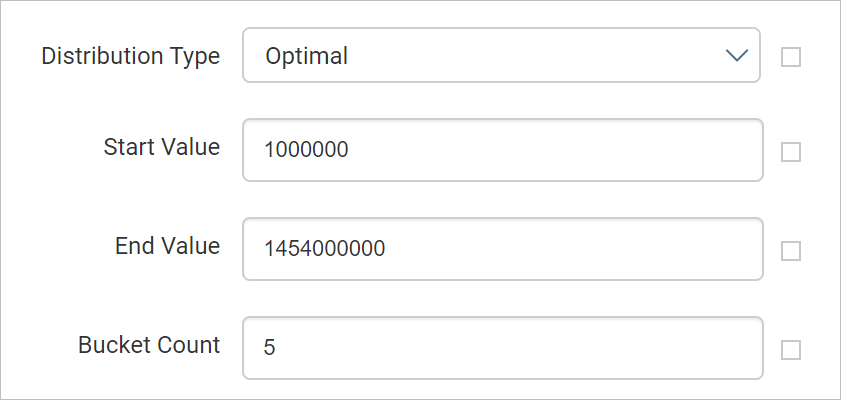
Bucket count
Based on specified bucket count, splits the data ranges. For example, if you specify bucket count as 25, the data between start and end values will be split into 25 ranges.
You can also set bucket based on dynamic values, by using the Expressions. Refer Set Expressions and Reset Expressions section to open set/reset expression menu in properties panel.