Chart Smart Label
Smart labels manage overlapping of labels even when a large number of labels are placed in close vicinity.
Enable or disable smart label
To manage overlapping of labels on report preview, toggle the Enable Smart Label checkbox.
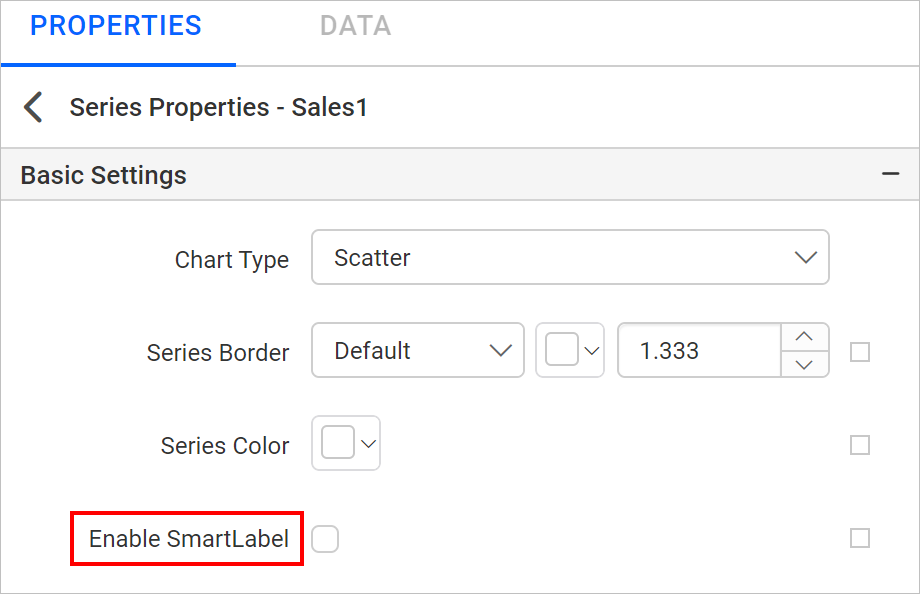
If you enable the Enable Smart Label checkbox, the label properties will be applied to the data label in respective series of chart.
You can also enable or disable the smart label based on dynamic values, by using the Expressions. Refer Set Expression and Reset Expression section to open set/reset expression menu in properties panel.
Format smart label
You can customize the data label appearance through the properties provided in the Advanced menu of smart label property. Click on the square icon in the right side of the Enable Smart Label checkbox and click on Advanced option in the menu.
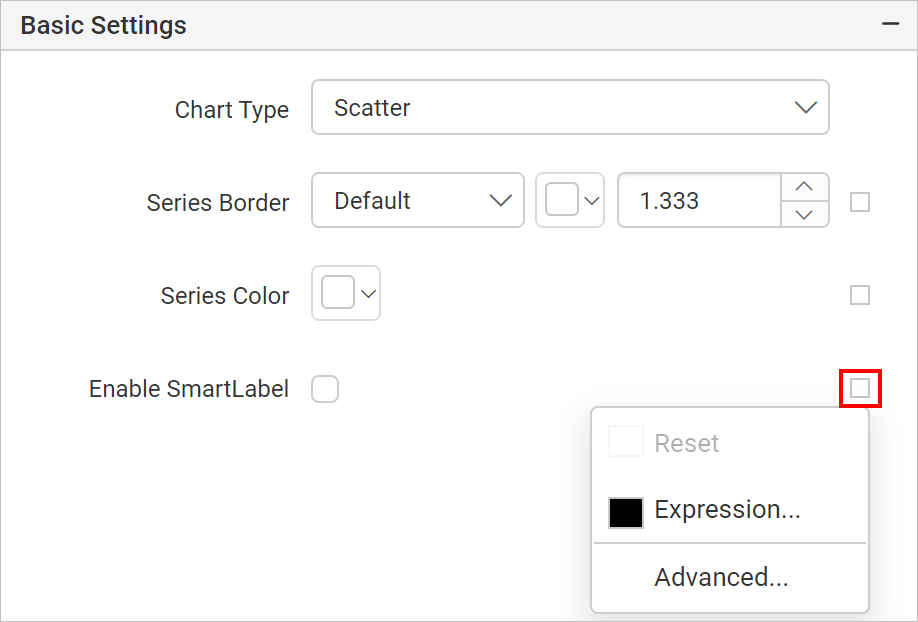
Now, the smart label properties will be displayed in the Advanced Options category.
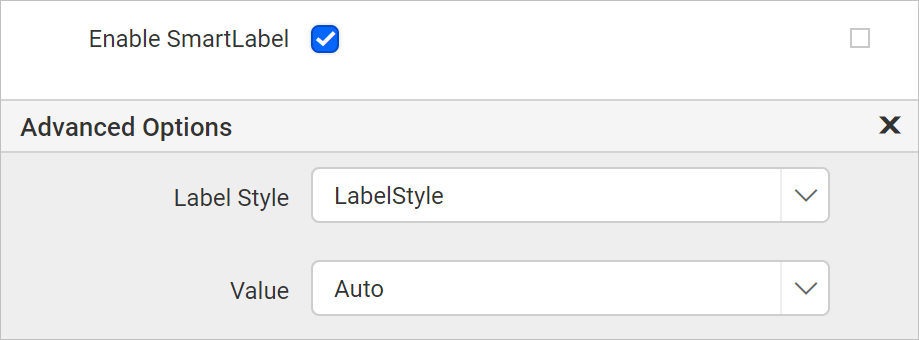
Label Style
The label styles are listed in the Label Style drop-down.
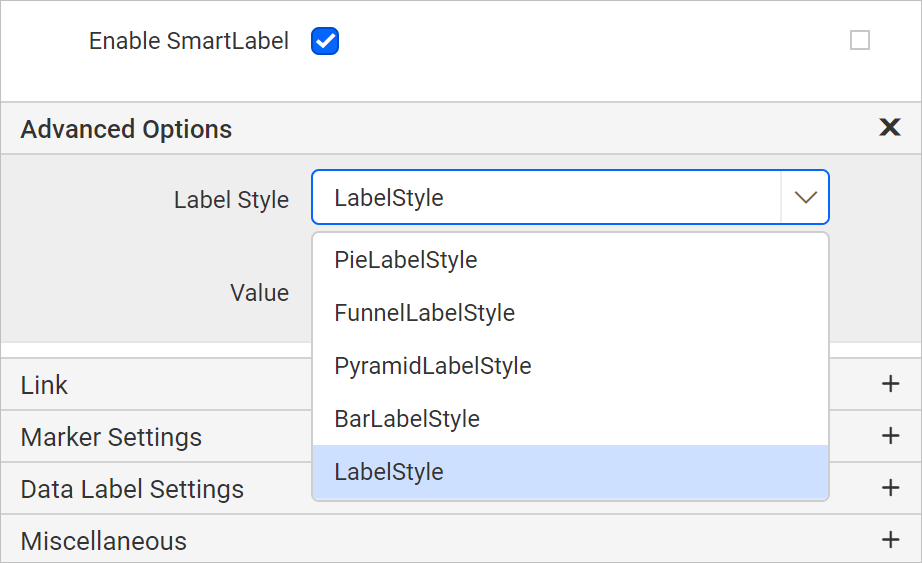
Set the label type based on the type of chart that are used to present the data.
Value
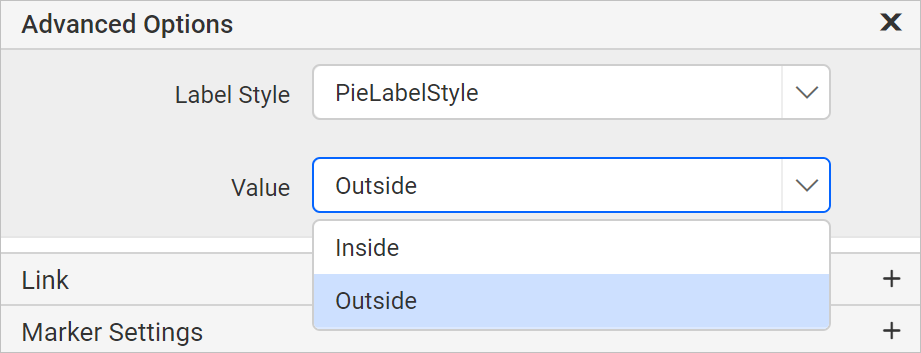
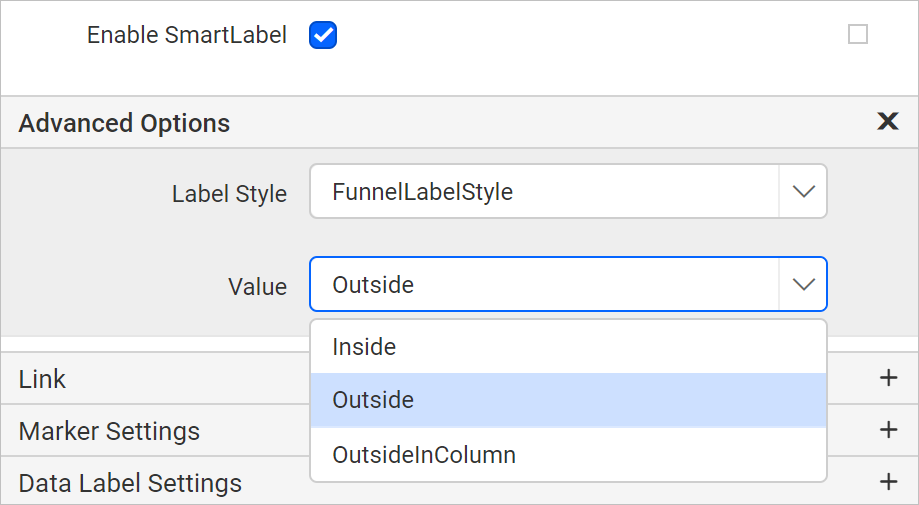
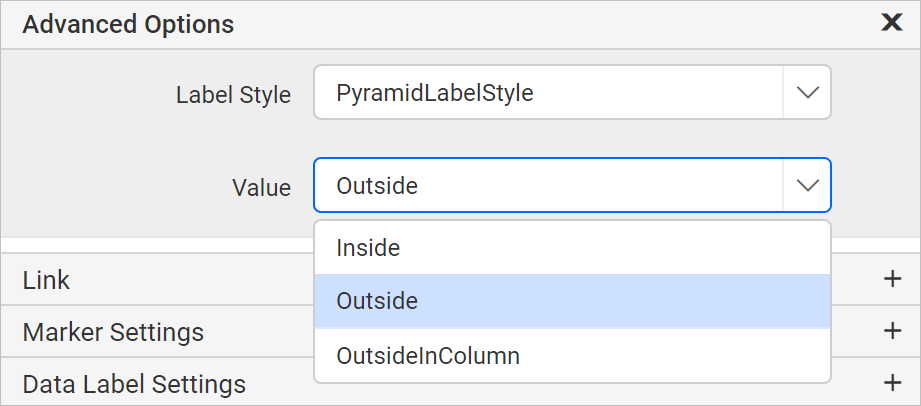
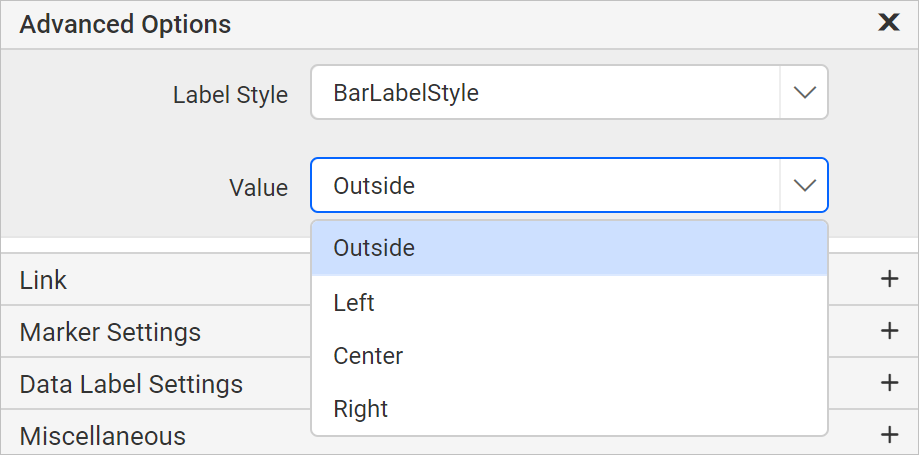
Based on the selected Label Style, the values will be listed in the Value drop-down.
PieLabelStyle
FunnelLabelStyle
PyramidLabelStyle
BarLabelStyle
LabelStyle
Common label styles will be listed in the Value field drop-down for Label Style type. The selected Value applied to the chart data region based on the selected chart type.
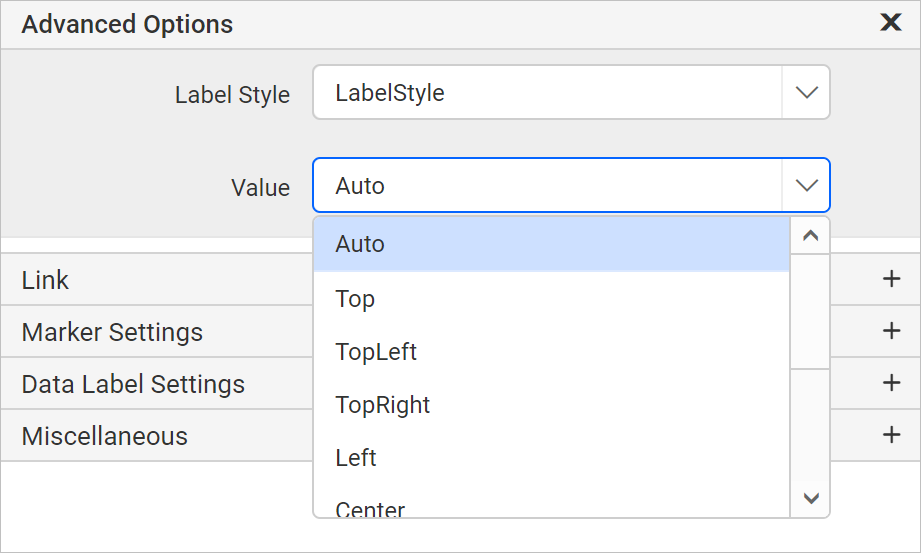
In the below design, pie chart is used of demonstration.
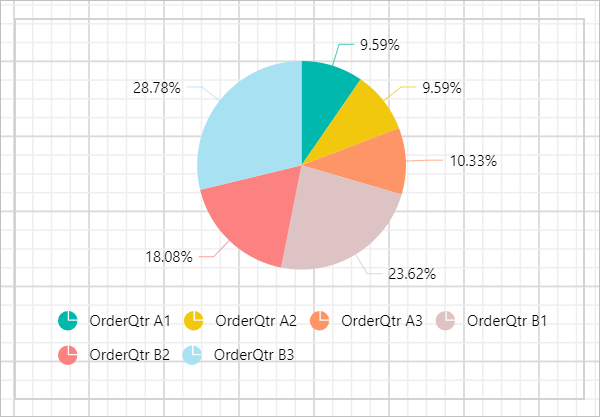
Select PieLabelStyle in Label Style drop-down and choose Outside in Value field. Now, the chart design will look like below.
Now, choose Inside in Value field. Now, the chart design will look like below.
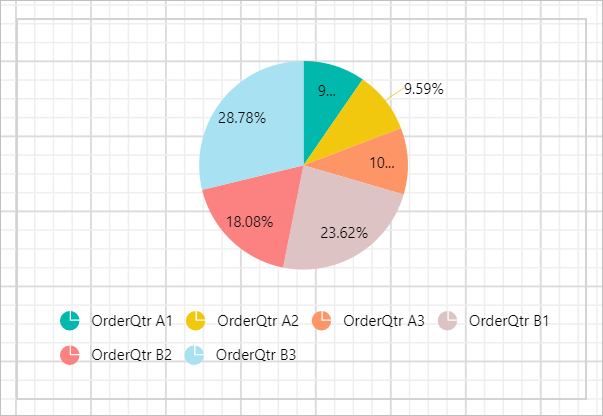
On above snap notice that some labels are shown outside for better design, the smart label property manages to avoid overlapping of labels and improves the chart design.