Tablix Wizard
The tablix wizard helps user to design reports that display data in a tabular or matrix format. It provides options to define row and column groups for organizing data hierarchically.
Overview
-
The tablix wizard is listed in the item panel under the
Data Regionscategory.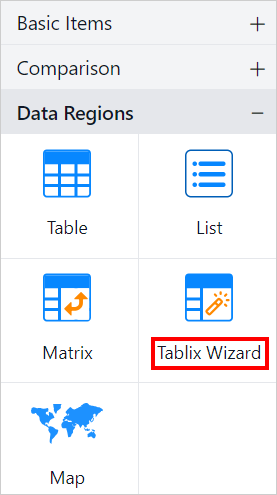
-
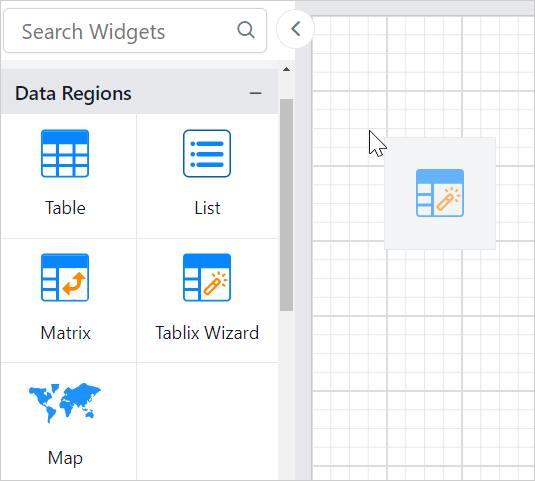
Drag and drop the tablix wizard report item into the design area from the item panel.
-
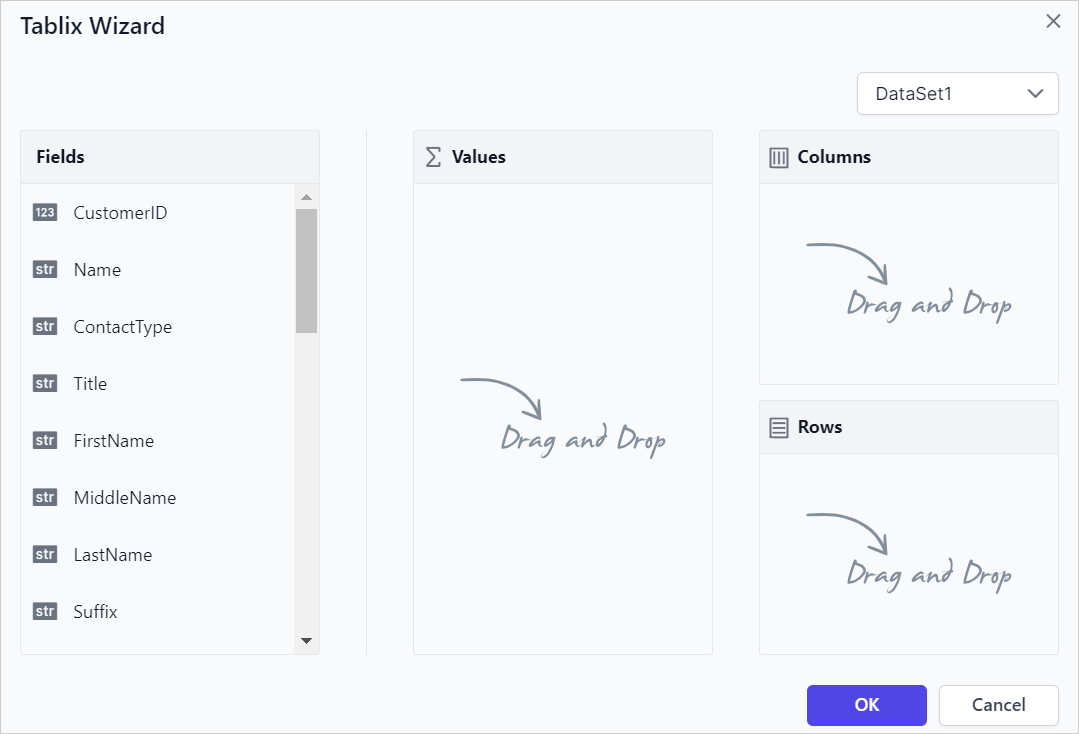
The Tablix Wizard will be rendered as shown below,
-
Data- The available dataset in the report is listed in the Dataset drop-down. -
Fields- This list box displays the fields available from the dataset which is selected in the drop-down list. -
Values- Users can drag and drop fields into theValuessection to specify which data to analyze or summarize in the Tablix view. -
Columns- Users can add fields to theColumnssection to display data in a hierarchical column view in the Tablix design. -
Rows- Users can add fields to theRowssection to display data in a hierarchical row view in the Tablix design.
-
-
Drag and drop the required fields into
Valuessection to create a flat table design.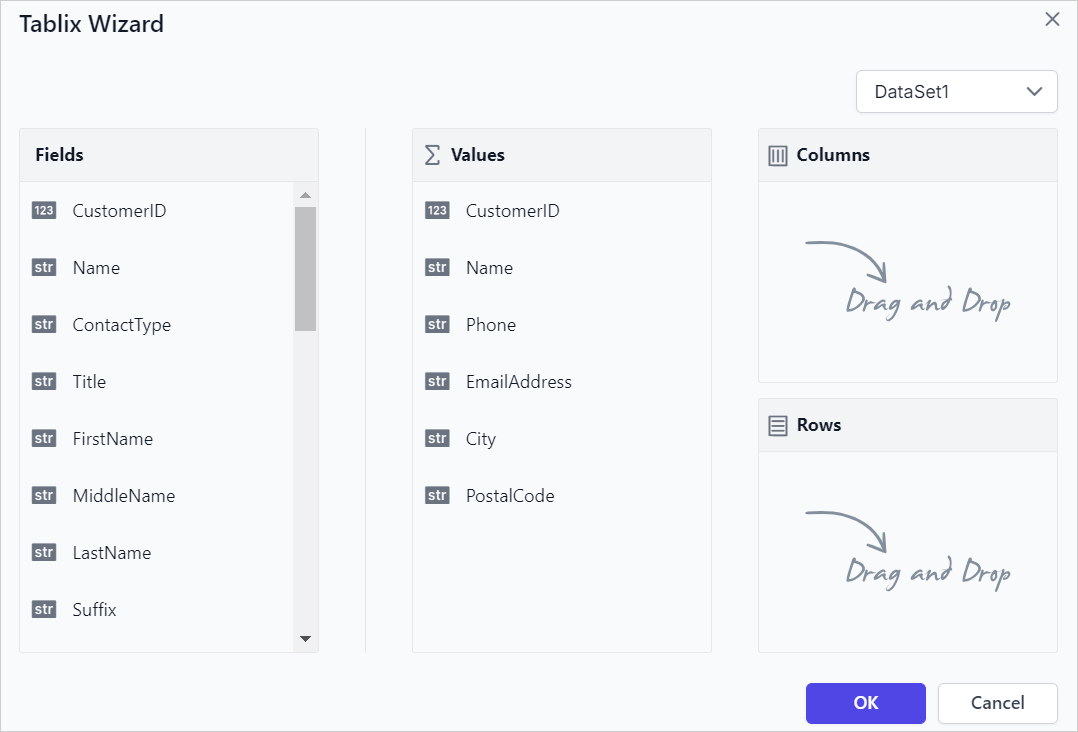
-
Click the
OKbutton. The table design will render on the design surface as shown below,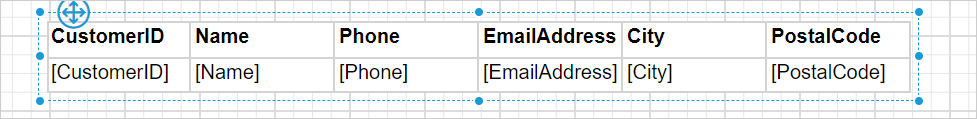
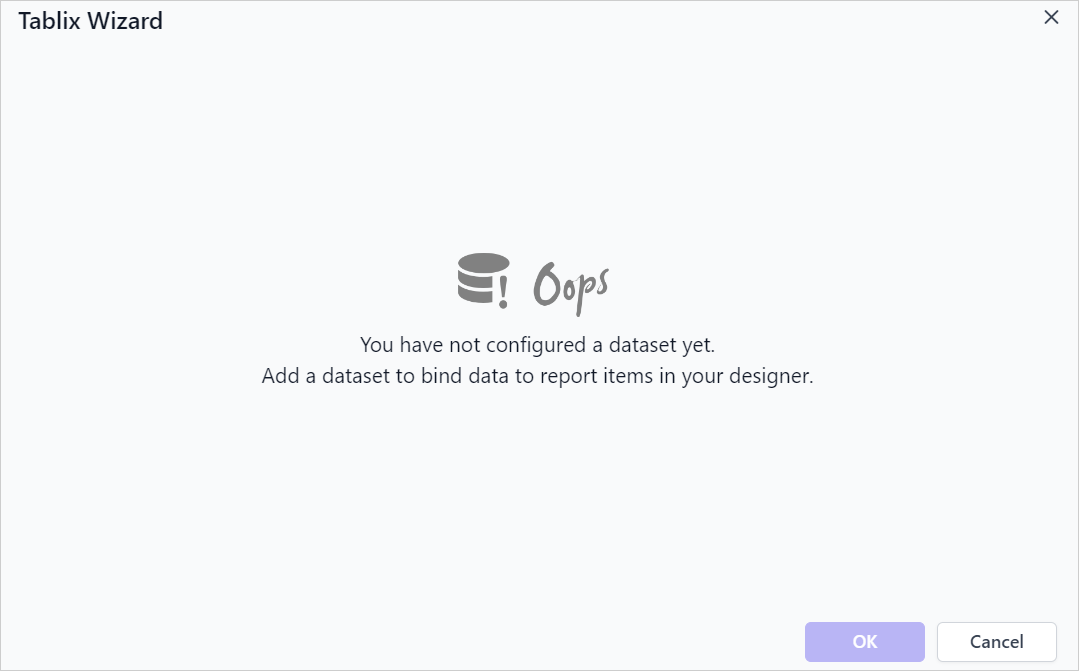
If the report has no datasets, the Tablix Wizard interface will display as shown below.