Design ssrs rdl report using table
The following steps guides you to design ssrs rdl report using table.
Add a table to the report
- The table report item is listed in the item panel under the
Data Regionscategory.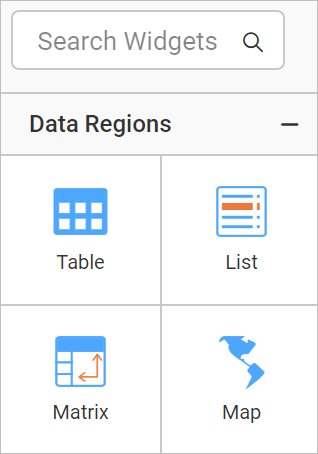
- Drag and drop the table report item into the design area from the item panel.
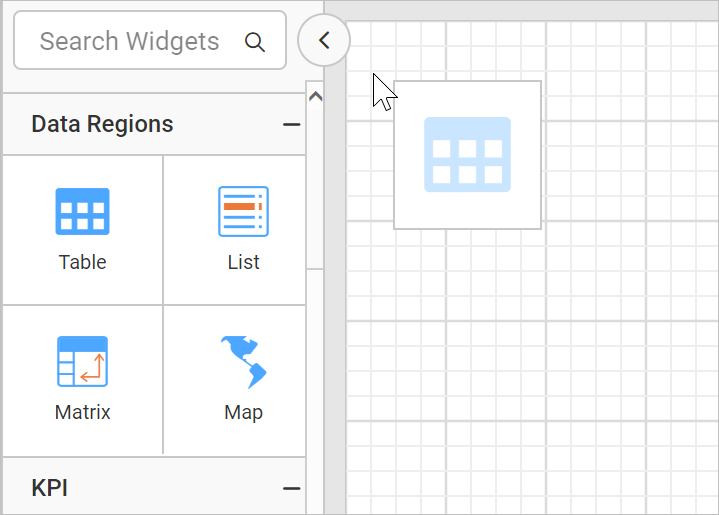
- Respective table properties will be listed in the properties panel.
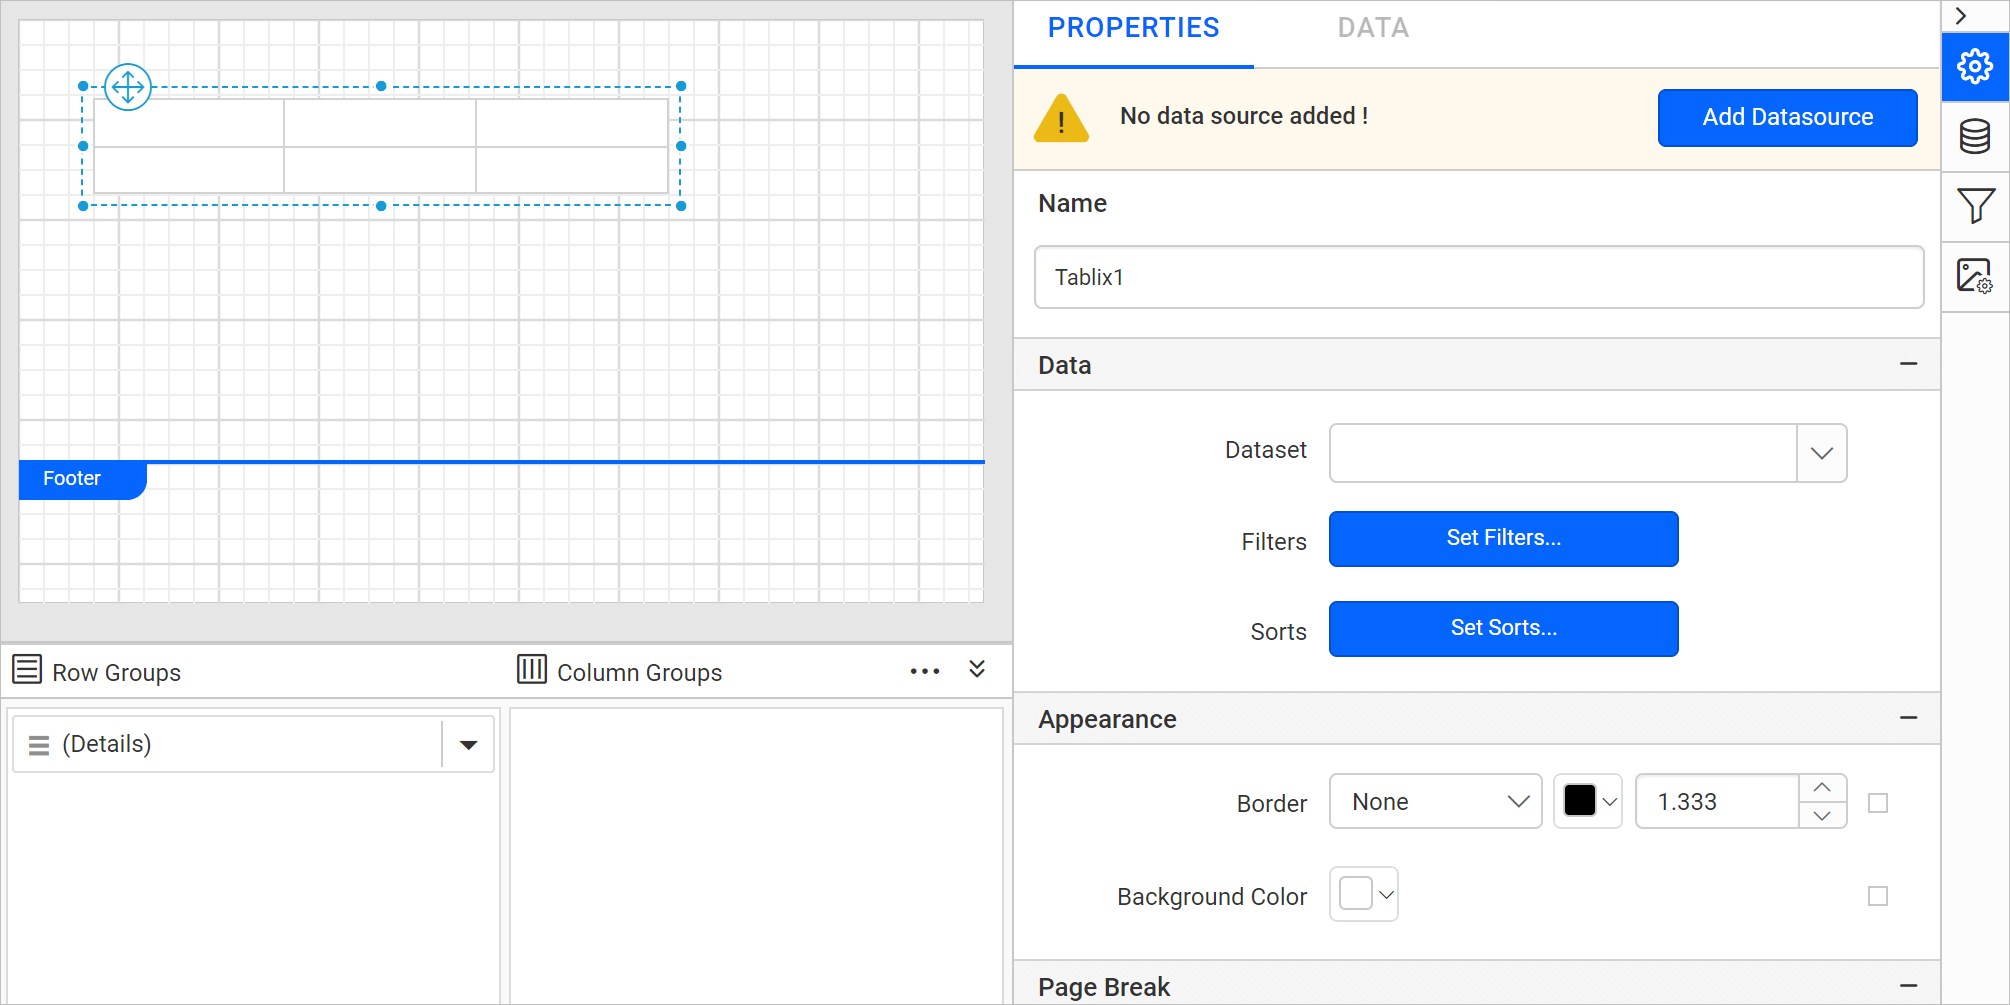
Initial design
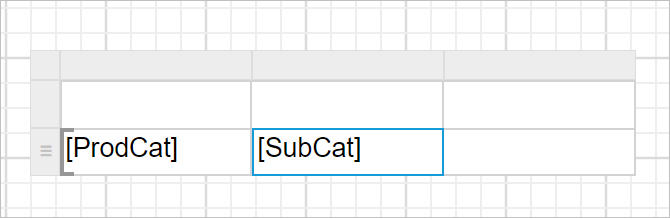
Once you drop the table item, the Table renders with two rows and three columns in the design area.
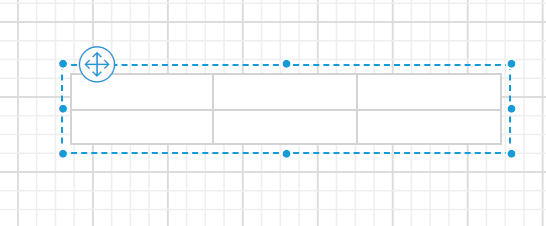
Each cell in the table is nothing but a simple textbox. The cell in a list contains a rectangle. You can replace a default report item with a different report item.
Assign data fields
There are a few different ways to assign the fields into a table:
- Drag and drop data fields from the
DATApanel. - Select the field from the data assign menu provided in each cell.
- Set expression using Multi-Text Run Editor Dialog.
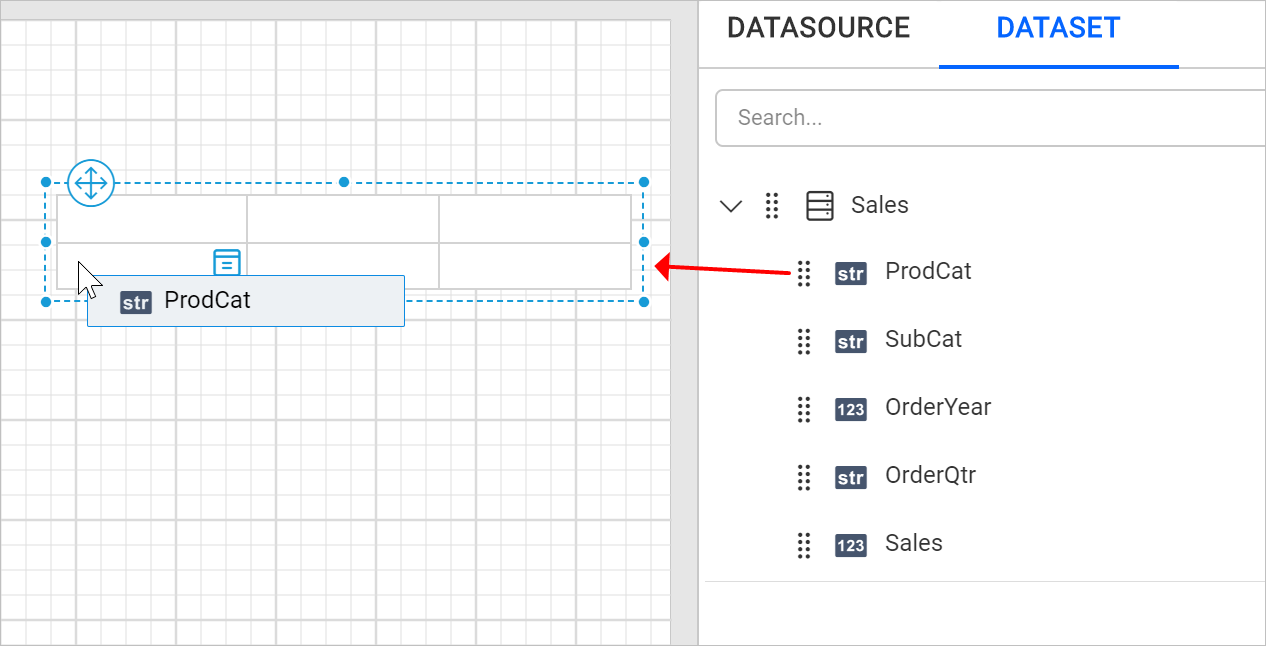
Drag and drop data fields
- Open the
DATApanel and expand the required dataset.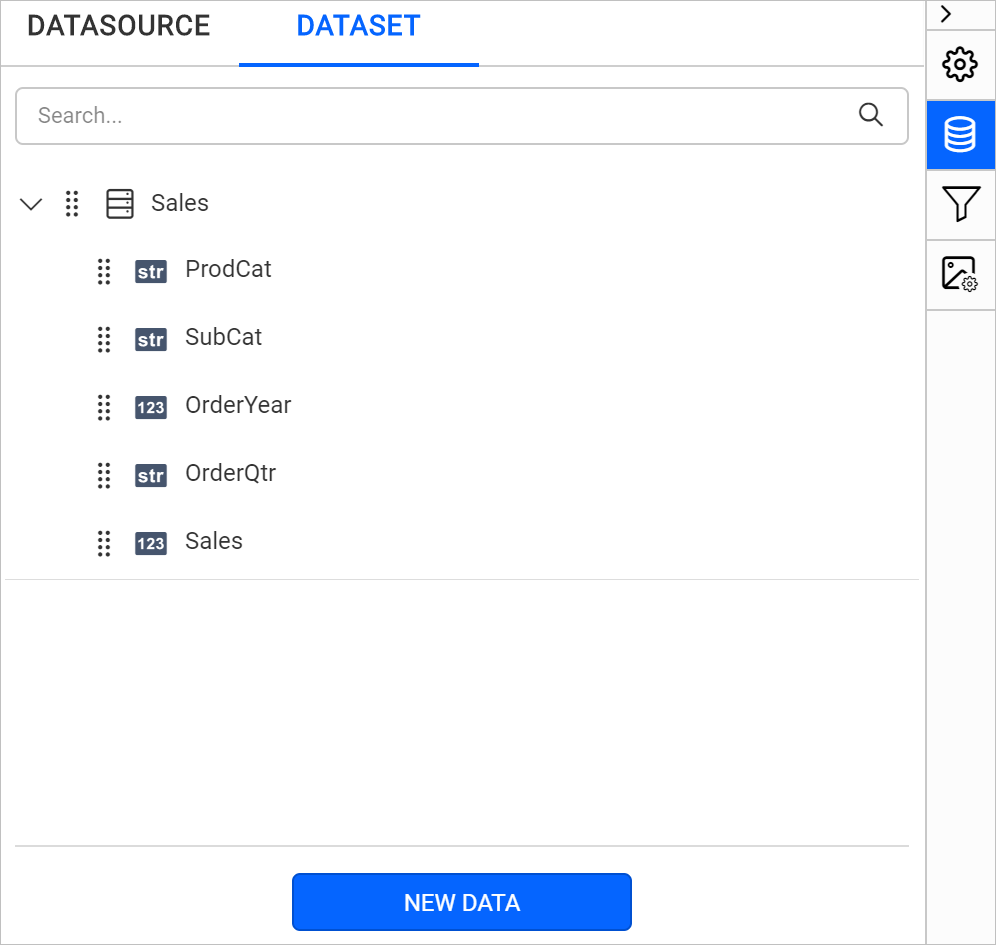
- Drag a field from the list and drop into a required cell.
Assign fields using data assign menu
-
Select the table cell and click on the
Data assignmenu icon to open data assign menu.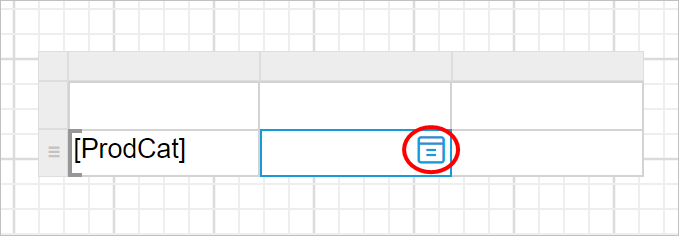
-
Click on the required data field name in the menu.
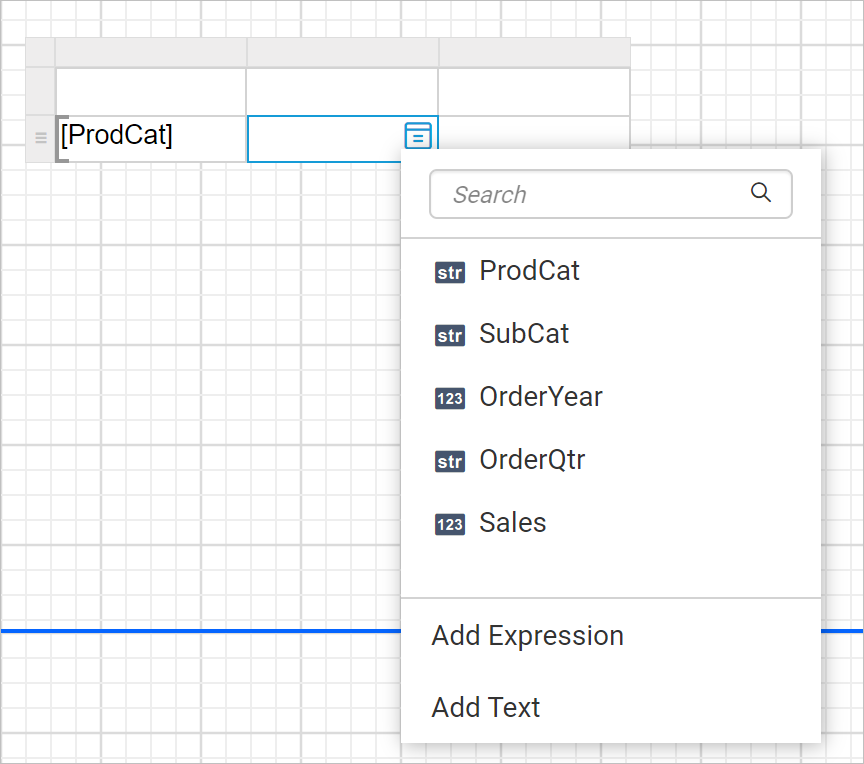
The fields of the dataset which is assigned to
Datasetproperty of table will be listed in the menu. -
Now, the respective field will be assigned to the respective cell like below.
Set expression using data assign menu
- Select the table cell and click on the
Data assignmenu icon to open data assign menu.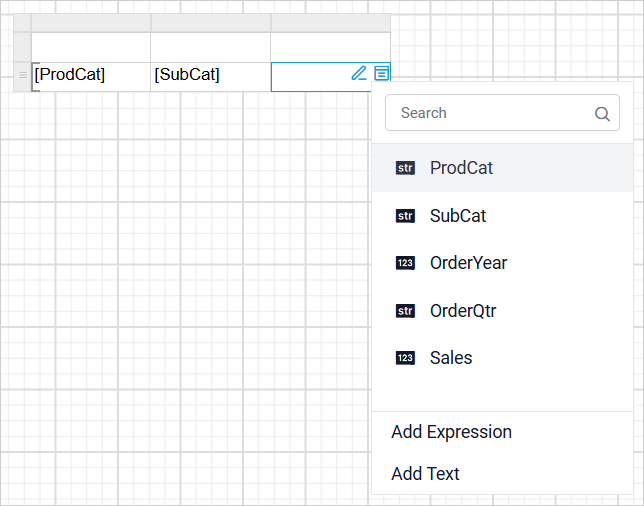
- Click the
Add Expressionoption from the menu. TheExpression Editordialog opens, as shown below.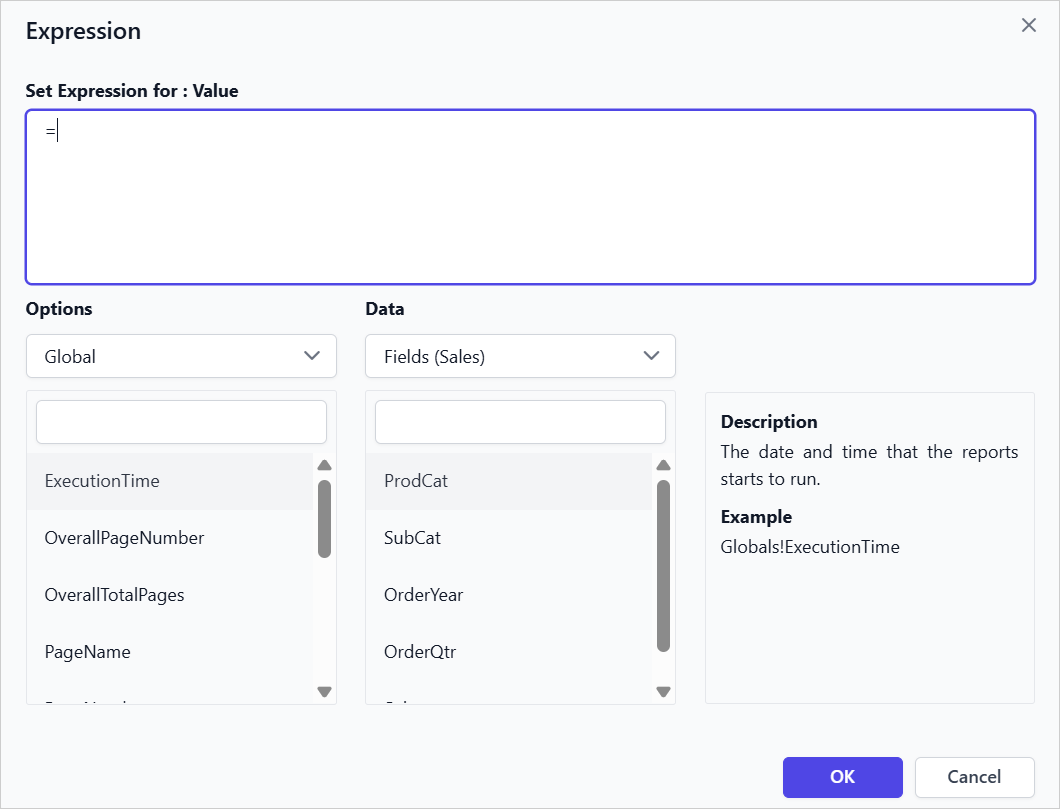
- Set the Expression in the Expression editor and click
OK.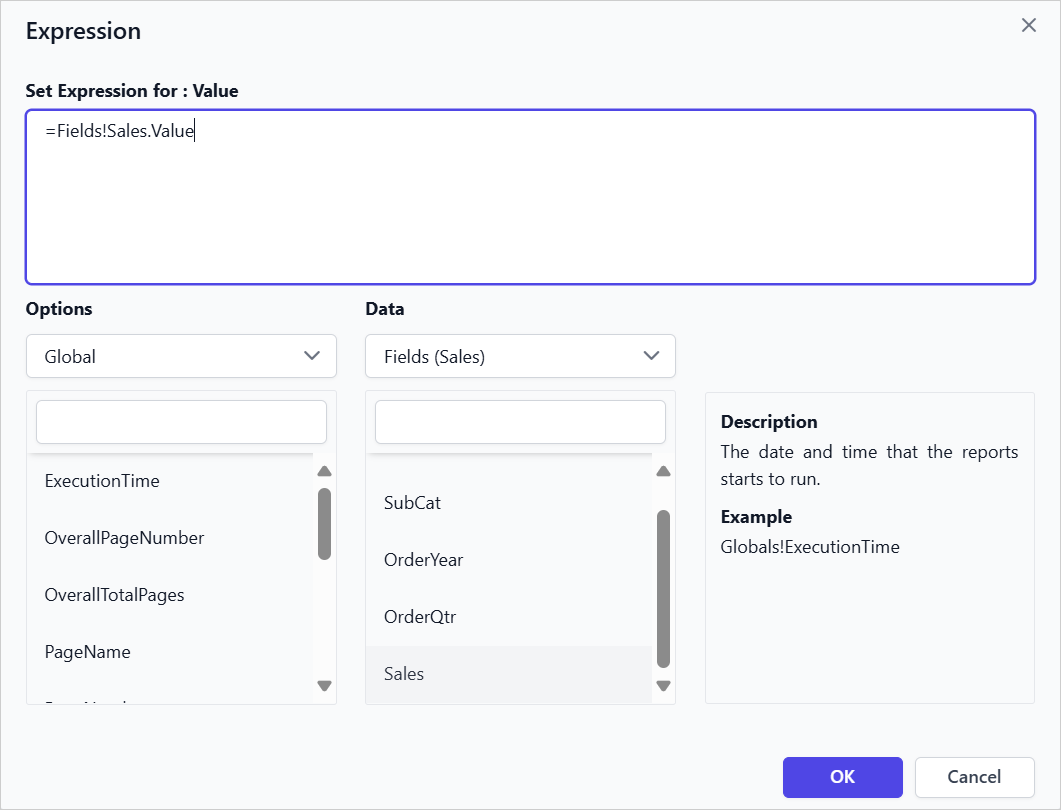
- Click
OKto assign added expression into the respective tablix cell.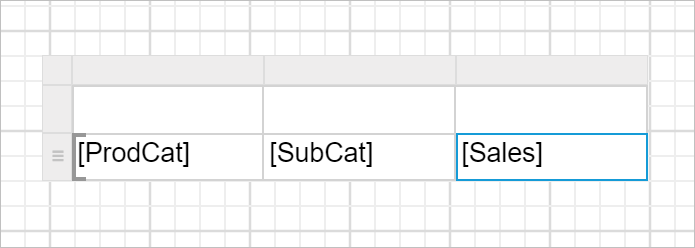
Set header text using data assign menu
- Select the table cell and click on the
Data assignmenu icon to open data assign menu.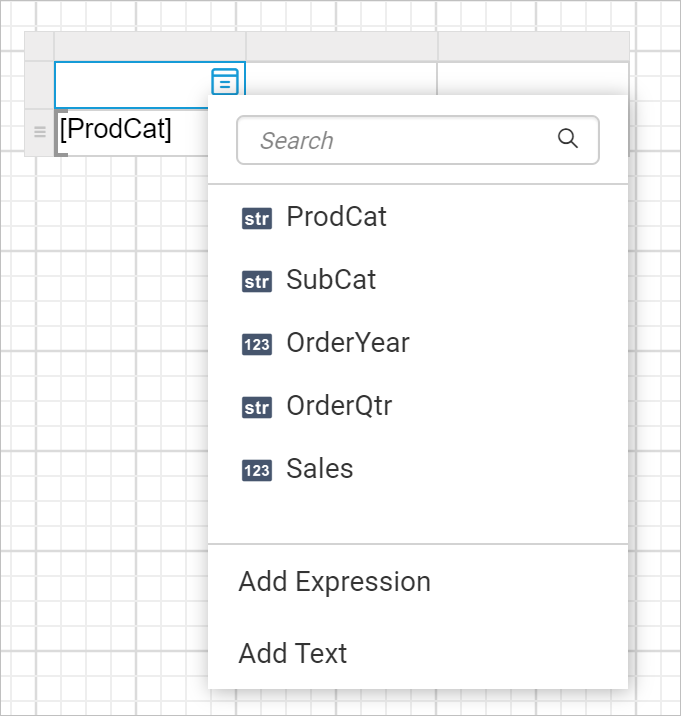
- Click on
Add Textoption in the menu. Now,Multi-Text Run Editor Dialogdialog will be opened like below.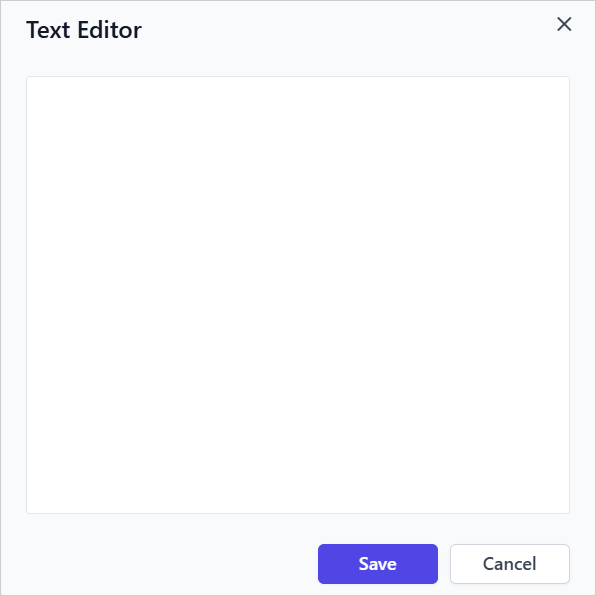
- Enter the desired header text in the text editor area and click the
Savebutton.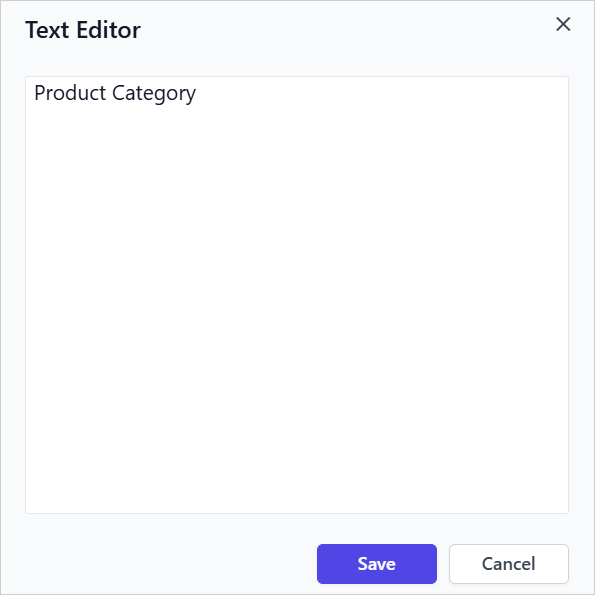
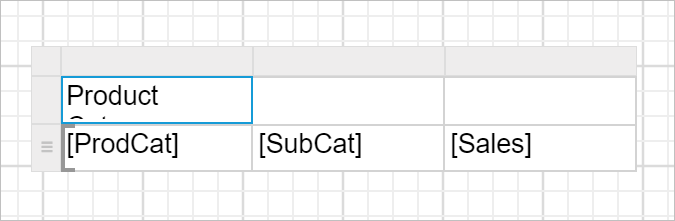
- Now, the text will be displayed in the respective cell like below.
Resize the column
To improve the report readability, we can resize the table row height and column width.
- Place the mouse pointer in the respective column border.
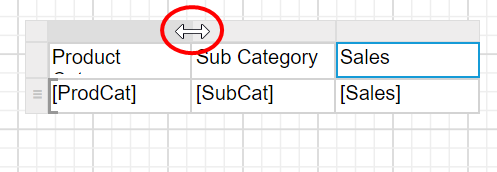
- Drag the column gripper horizontally, to adjust the column width.
Resize the row
- Place the mouse pointer in the respective row border.
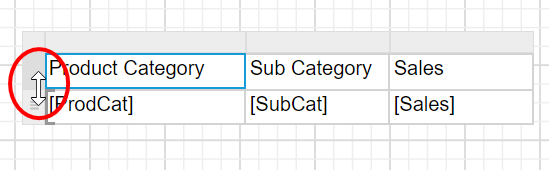
- Drag the row gripper vertically, to adjust the row height.
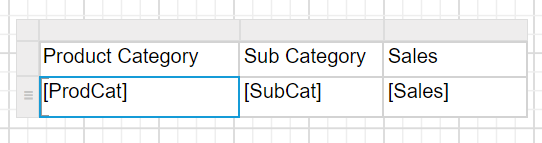
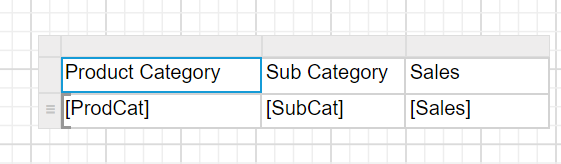
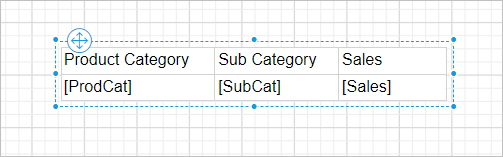
Final design
A simple table design will look like below.
Download the above report design from link.