Properties
Refer the Properties panel section before proceeding with the below properties.
Basic Settings
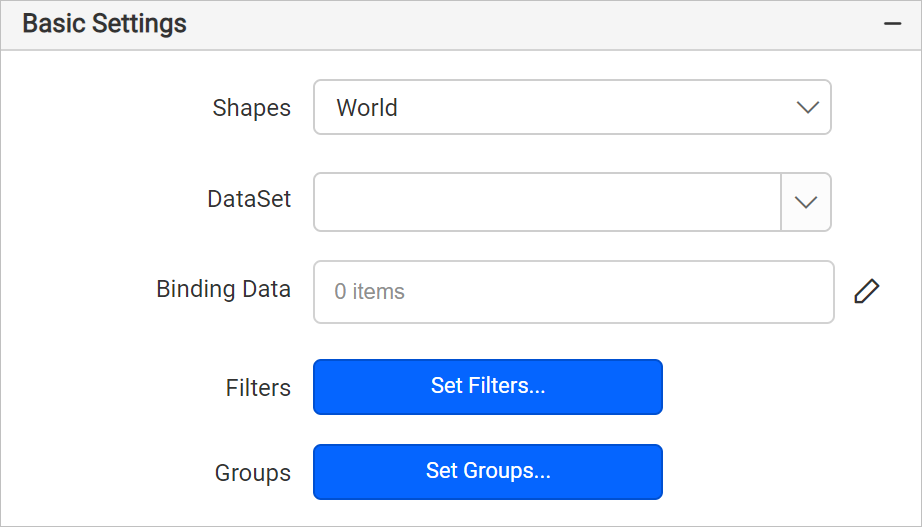
Shapes
A map layer can display either a build-in or custom shape data. The Shapes property will display the build-in and custom shapes that are available for the report.

To import custom shape files into Report Designer, refer Import shape files section. Choose the required shape data from the drop-down to render the respective map in design area.
Dataset
This property is used to assign the dataset to the map. The available datasets in the report will be listed in the Dataset property dropdown. You can choose the desired dataset from the drop-down.
Each map report item can only show data from one dataset.
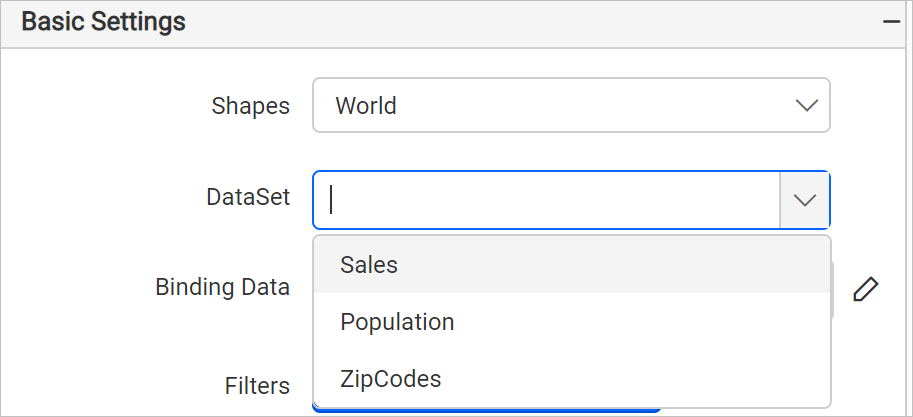
Refer Create Data section to add dataset to your report.
Binding data
To display analytical data on the map surface, first we need to link the analytical and shape data. The shape data is the map itself, whereas the analytical data is the data set we created. The analytical data provides meaning to the shape data. To bind analytical and shape data, refer to the Binding Data section.
Filter
Filters is used to filter the data in the map. To open the Filter dialog, click on the Set Filters... button. Now, the filter dialog will be opened like below.

Refer Filter Data section to add/remove filters in the filter dialog.
Groups
You can group the map elements with analytical data using this option. To open the Grouping dialog, click on the Set Groups... button in the properties panel. Now, the Grouping dialog will be opened like below.
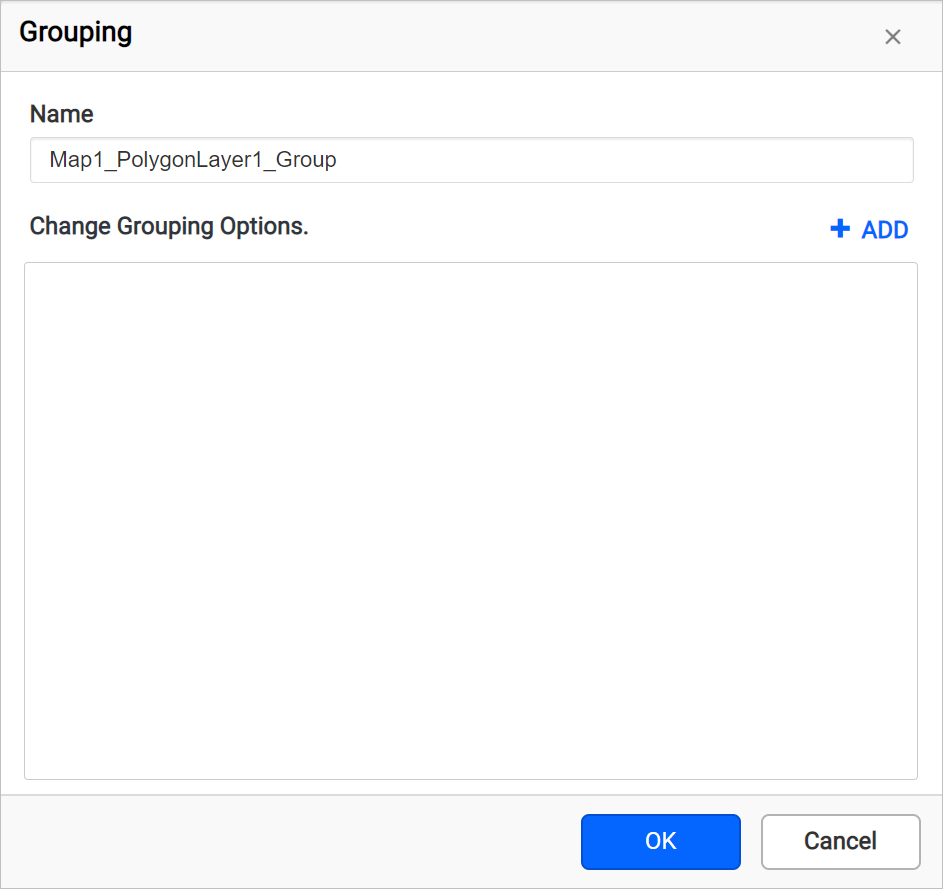
Modify the group Name or add a group expression in the group dialog and click OK. Refer Group Data section to add/remove groups in the grouping dialog.
Appearance
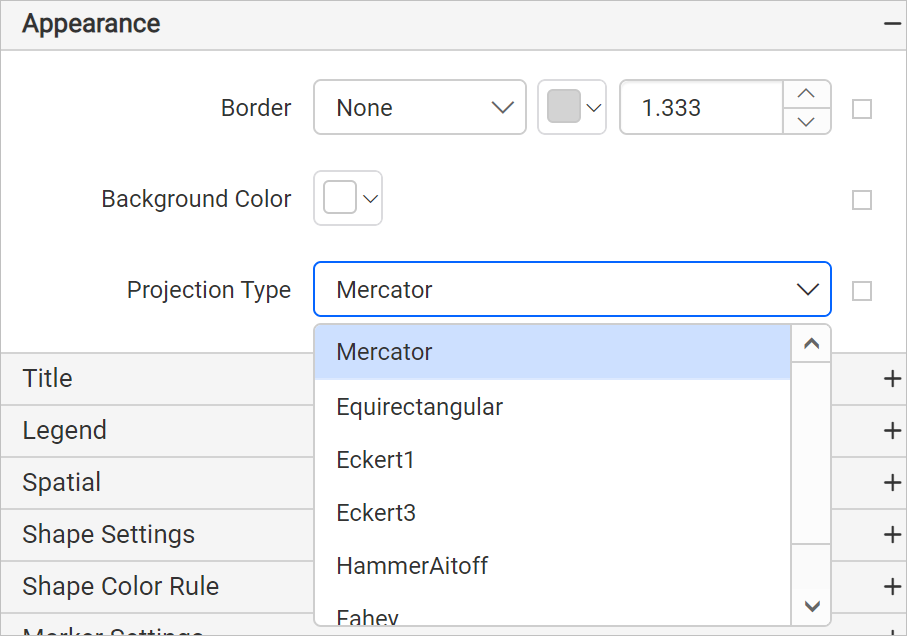
The border style, color, width, background color, and projection type properties are used to style the map and customize its appearance in the report design. These properties are listed under the Appearance category in the properties panel.
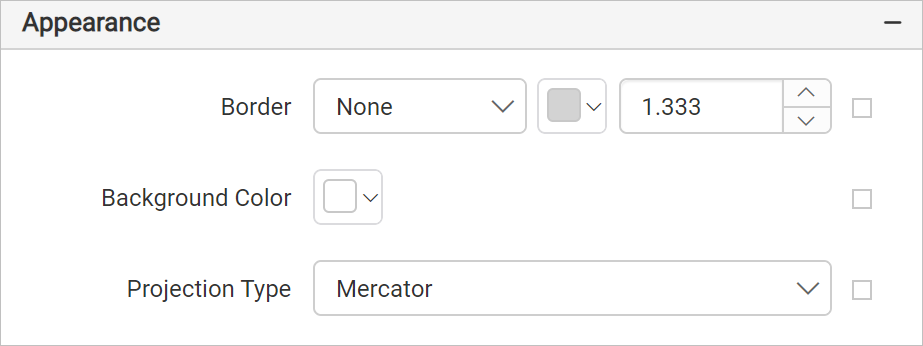
Border
Border properties are used to add or customize the border around a map item to visually separate it in the report design. To set border properties to the map item using properties panel refer Border Properties section.
Background color
Using the background color property you can color the map background. To set background color using properties panel refer Background color section.
Projection type
A projection is a set of rules that draws geographical data in two dimensional view onto a planar surface by transforming longitude/latitude coordinates to 2D coordinates. This property must be specified when shape data is geographic.
Title
The map title can be customized by editing the Text property of the map. To show/hide the map title, toggle the Enable Title checkbox.

You can customize the title text for map using this property. By default, the text will be displayed as Map Title. Specify the required title text in the title property textbox and it will be displayed as map title in map design.
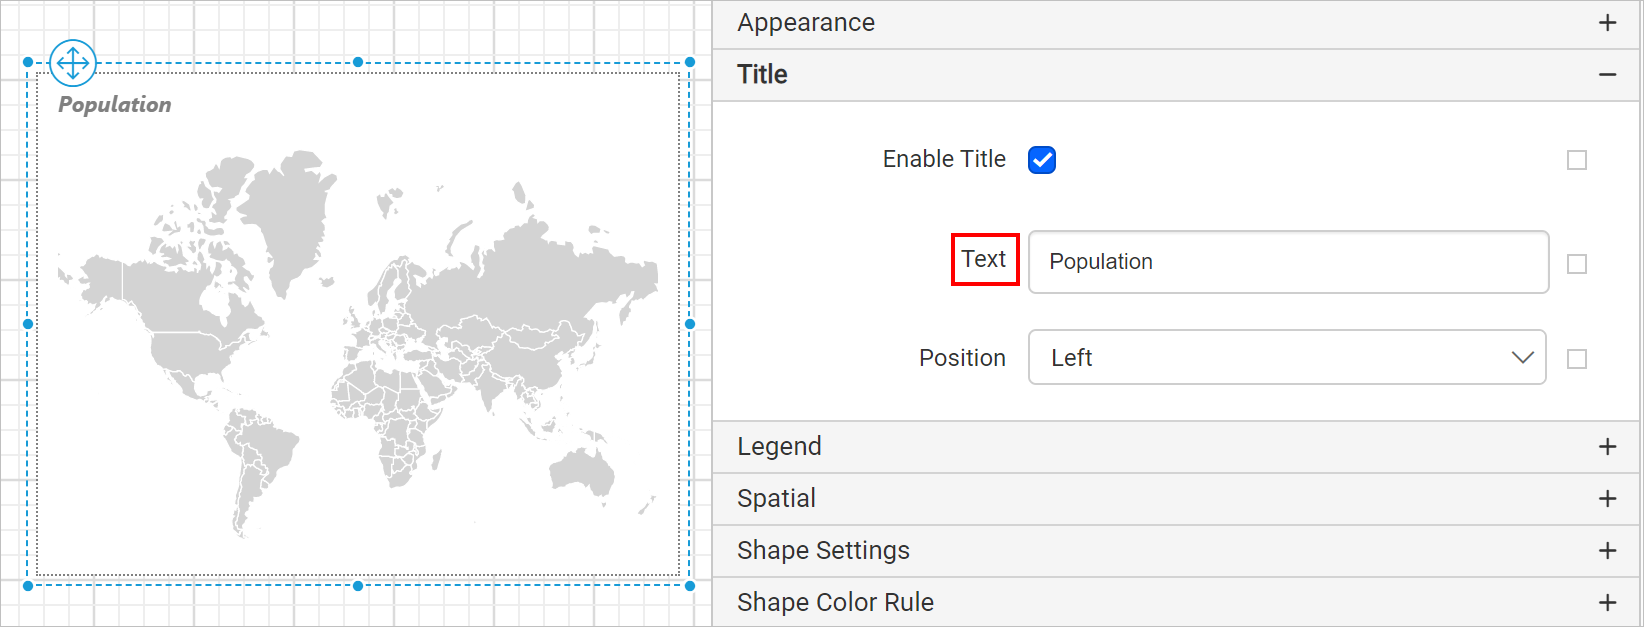
You can also apply title text based on dynamic values, by using the Expressions. Refer Set Expressions and Reset Expressions section to open set/reset expression menu in properties panel.
Title font
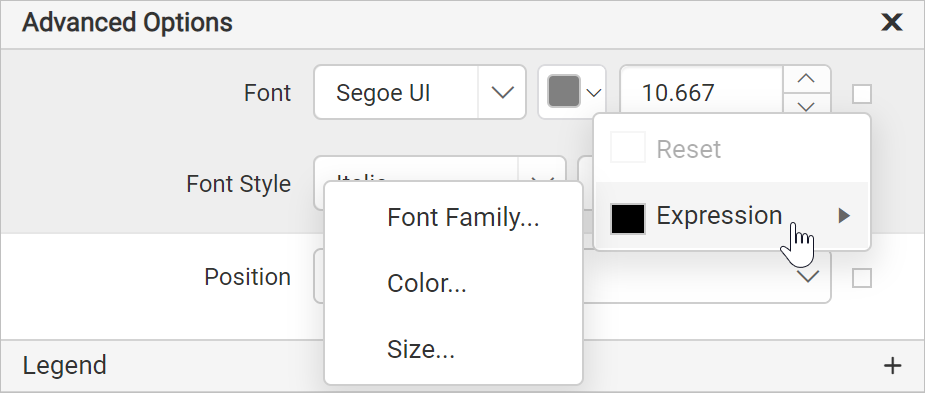
You can customize the title text appearance through the properties provided in the Advanced menu of title property. Click on the square icon in the right side of the Title text field and click on Advanced option in the menu.
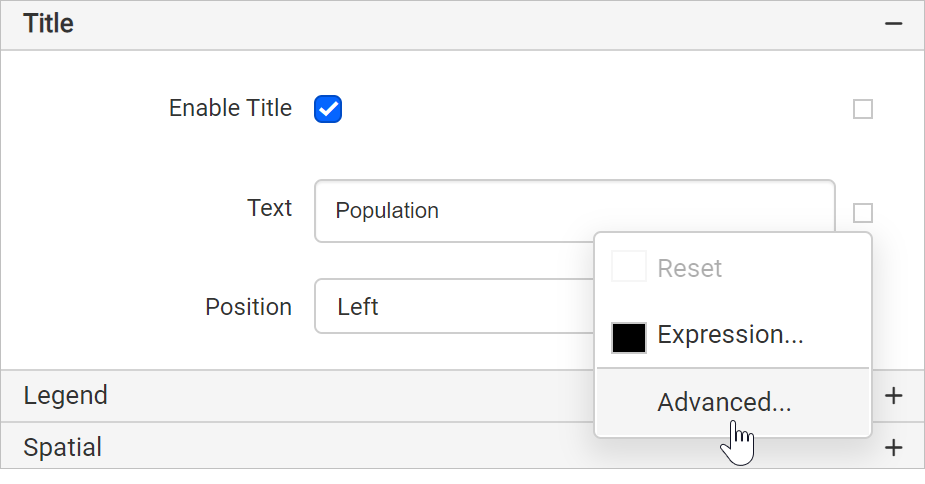
Now, the title font properties will be displayed in the advanced options.
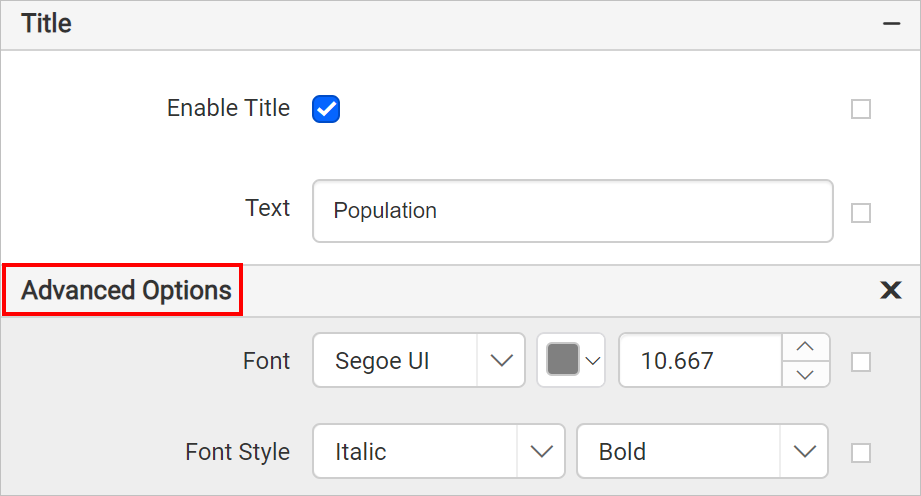
You can also apply font properties based on dynamic values, by using the Expressions. Refer Set Expressions and Reset Expressions section to open set/reset expression menu in properties panel.
Position
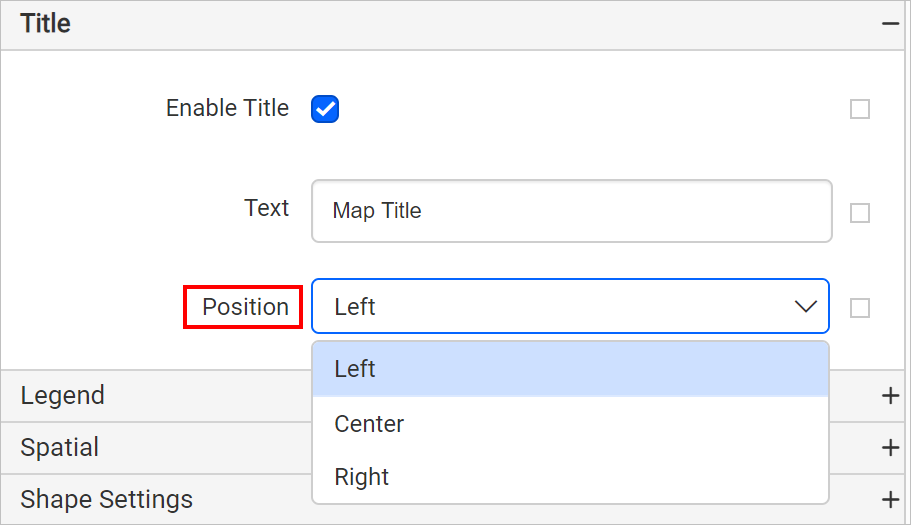
The title position can be customized using the Position property.
Legend
A Legend is a text used to describe the data plotted. This property allows you to toggle the visibility of legend in map and to customize the legend text appearance. To set/reset legend properties, refer Map Legend section.

Spatial

Fields : The match fields that are available in shape data are listed under Fields section. Click on the edit icon to view the fields,
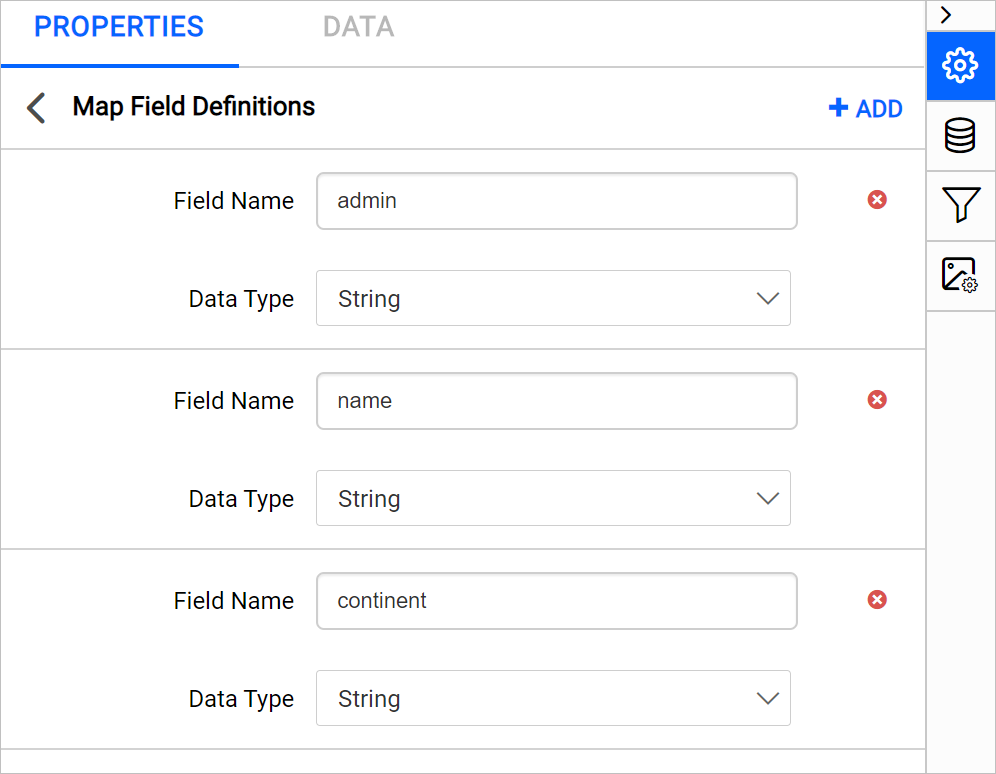
You can edit the field name or data type and delete the fields based on the design requirements.
Polygons : Each data of map shapes/polygons defined in shape data file are listed under Polygons section. Click on the edit icon to view the polygons information,
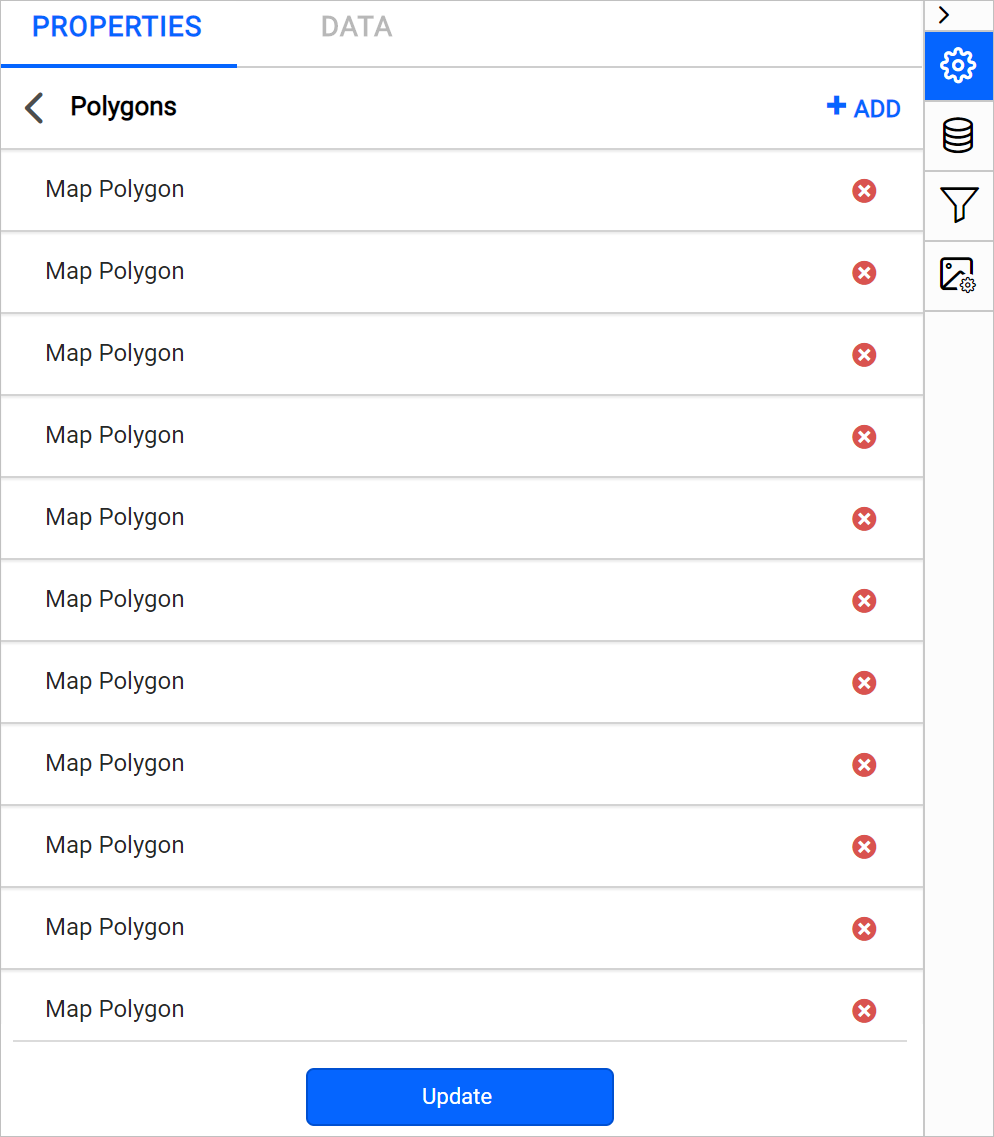
You can edit the polygon details and delete the polygons based on the design requirements. Hover on each polygons in the list and click on the edit icon,
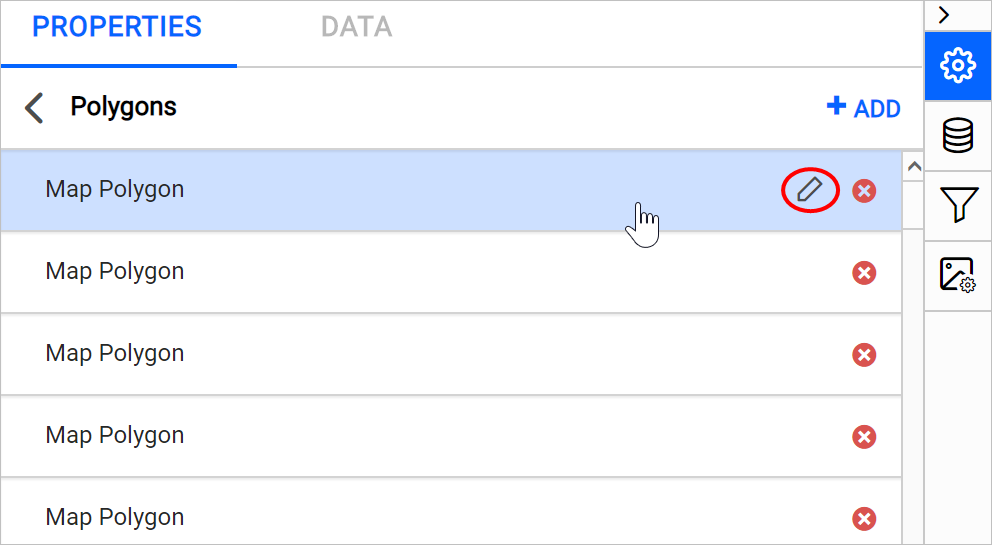
Respective polygon properties will be displayed like below,
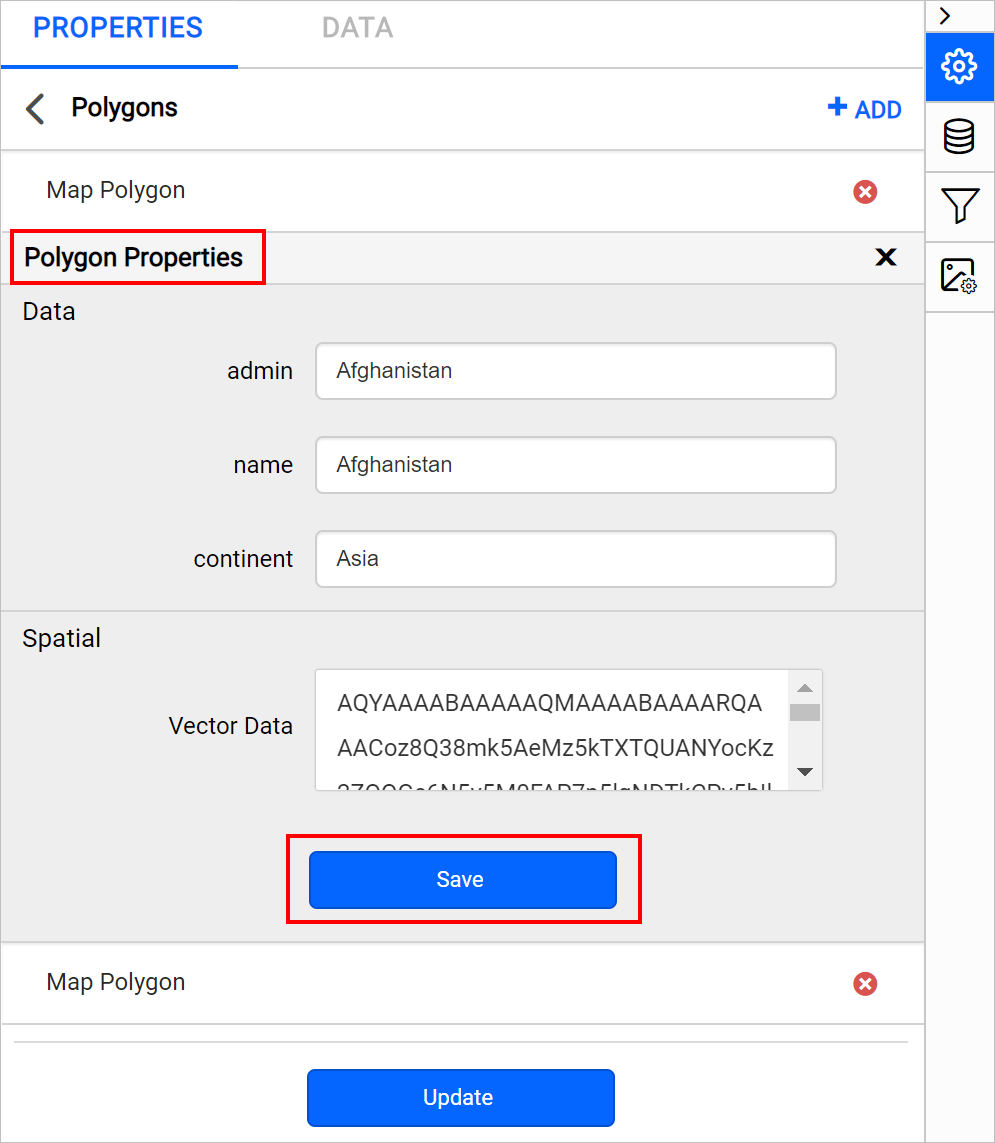
Edit the required properties and click on the Save.
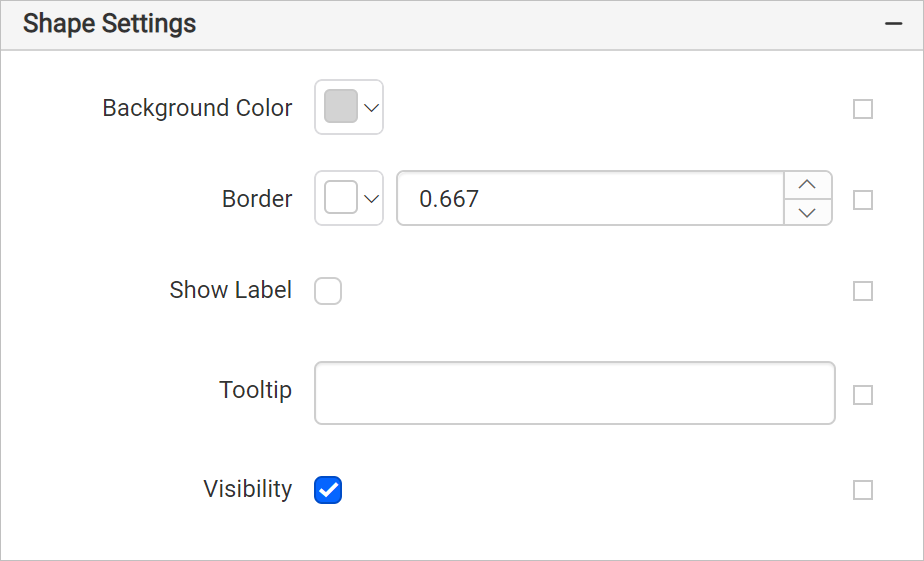
Shape settings
Each region in a map surface is called a map shape. We can set a label, tooltip, border, and background color for it. To set/reset shape properties, refer Map Shape Settings section.
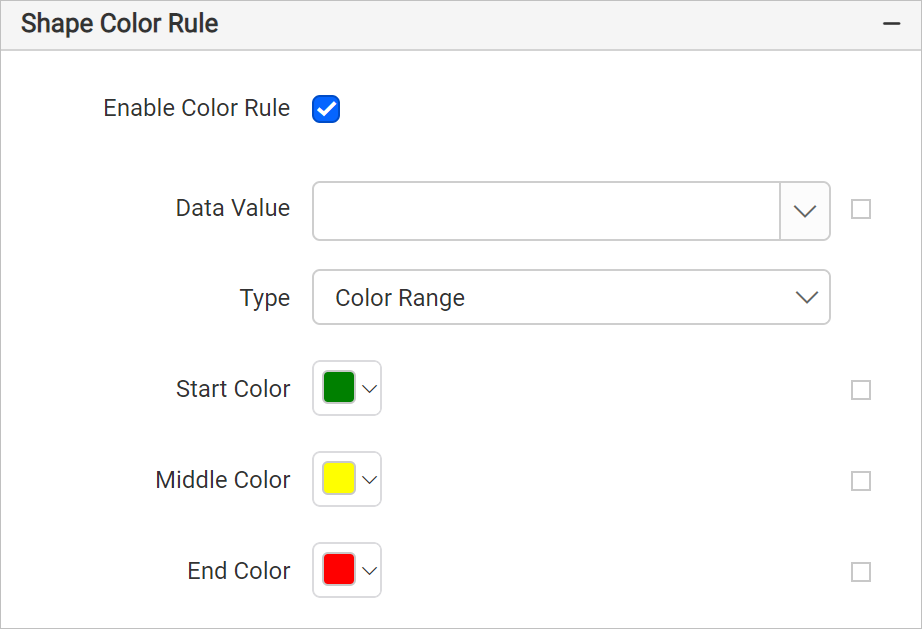
Shape color rule
The shape color rule properties can be used to define color options for each shape on the map surface. To set/reset shape color rule for map, refer Shape Color Rule section.
Marker settings
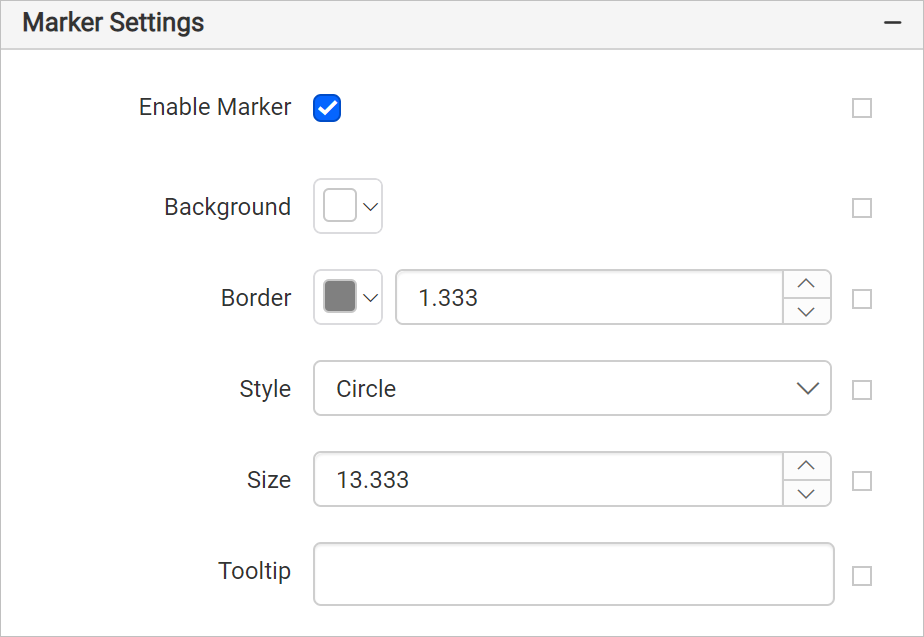
A marker identifies a location on a map. By default, a marker uses a standard icons. We can set background color, border, style, size and tooltip for it. To set/reset marker properties refer Map Marker Settings.
Marker color rule
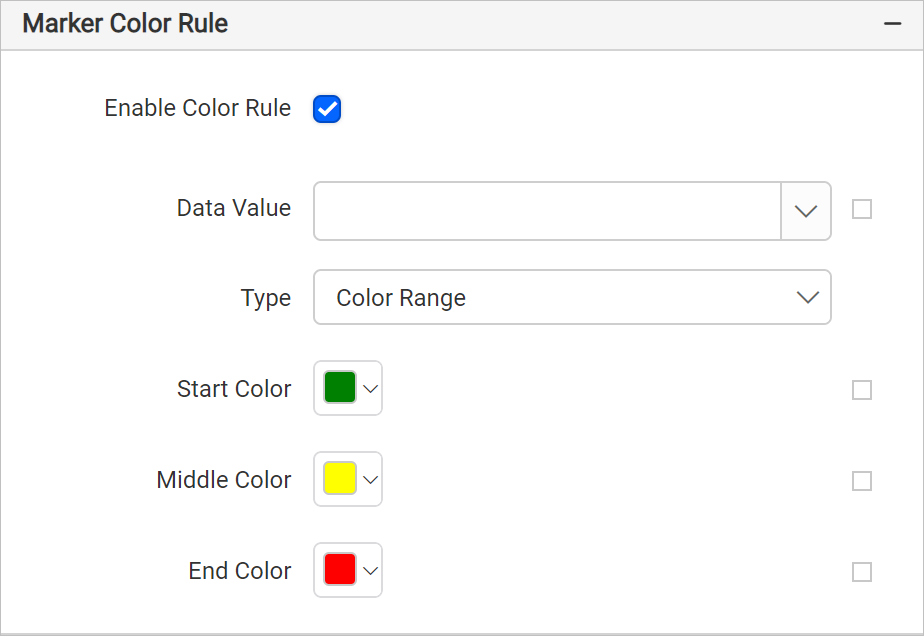
The marker color rule properties can be used to define color options for each marker on the map surface. To set/reset marker color rule for map, refer Marker Color Rule section.
Marker rule
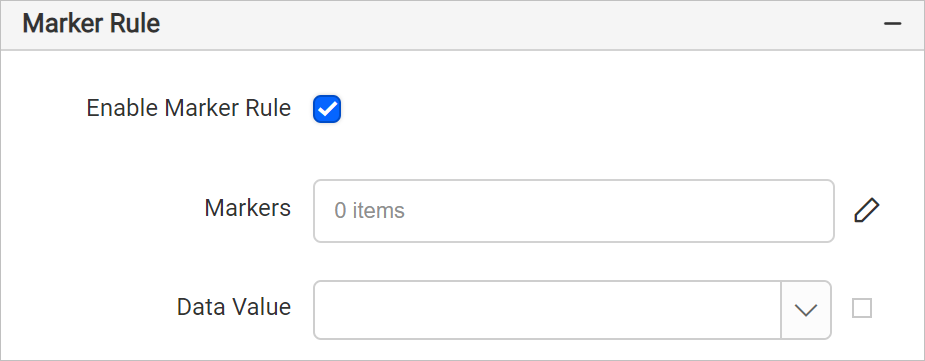
The marker rule properties can be used to define marker styles for each marker on the map surface. To set/reset marker color rule for map, refer Marker Rule section.
Page break
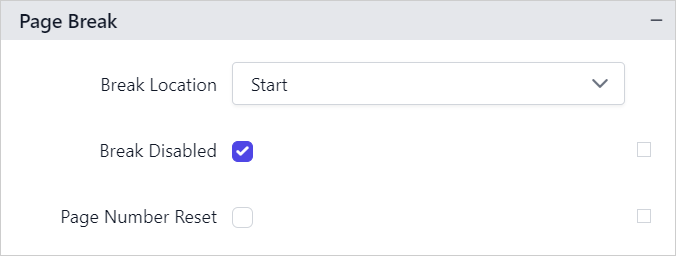
Page break property can be used to control the amount of information on each page when you preview the report. Follow the below steps to apply page break property for map report item.

Break location
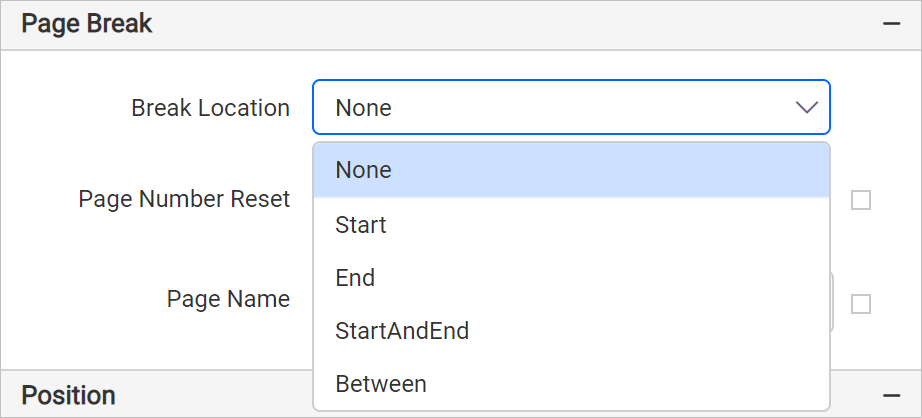
The Break Location property specifies where the page break should occur. Choose the required Break Location type in the drop-down.
Break Disabled
To prevent predefined page breaks from being applied during report preview, enable the Break Disabled property checkbox. You can also control the application of page breaks during report preview by using expressions. For details on setting and resetting page
breaks dynamically, refer to the Set Expression and Reset Expression sections.
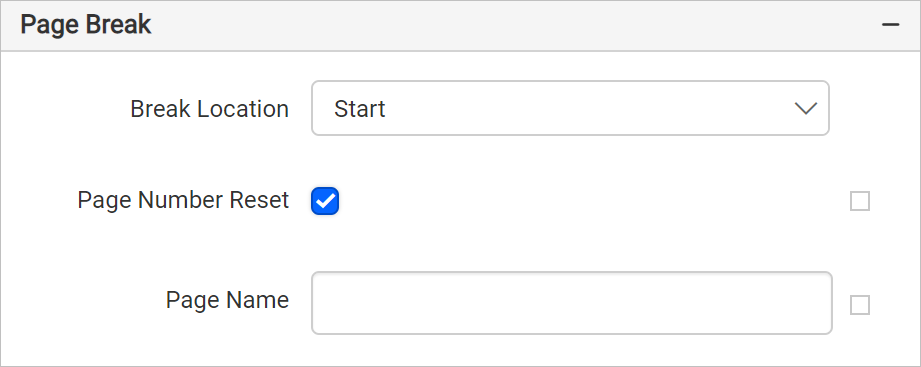
Page number reset
To restart page numbering on each page, enable the Page Number Reset property checkbox.
Position
Position property is used to set the width, height, left and top position of the map in the report design. To handle these properties using properties panel refer Position section.
Data Element
Data element can be used to control visibility of a report item when exporting the report in XML format. The Data element properties are listed in the properties panel, under the Data Element category.

Name
You can assign a custom name for the map element using the Name field. The map will be exported with the provided name.

Note: The name cannot contain spaces, and it must begin with a letter followed by letters, numbers, or the underscore character (_).
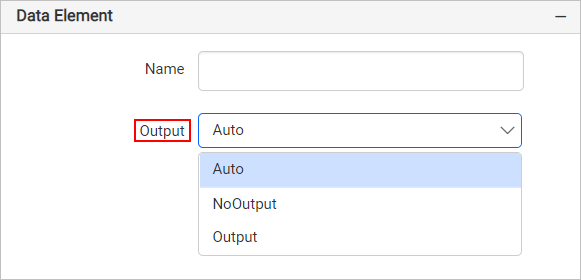
Output
On exporting the report, the visibility of the map can be controlled using the Output property. Choosing the following options for the Output property will perform the respective operations:
- Auto or Output - Exports the map report item
- NoOutput - Does not export the map report item
Visibility

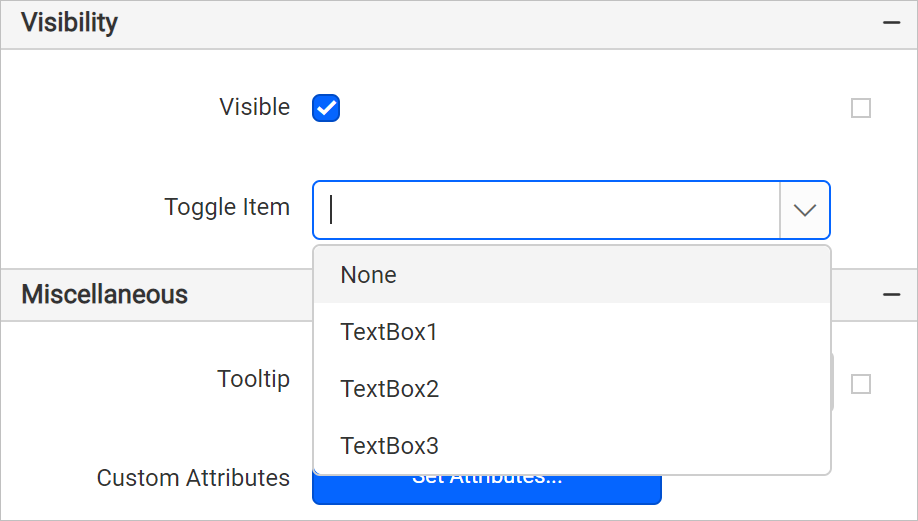
Visibility - Visibility property is used to conditionally show or hide the map report item on report preview or export action. To set visibility of map item using properties panel refer Visibility section. Toggle - The toggle settings property can be used to interactively toggle the map report item visibility by another report item.
Miscellaneous
Page name
The page name property is used to name the first worksheet of the Excel workbook, when exporting the report to excel format.

You can set the static or dynamic text as page name. To set and reset dynamic text, refer Set Expression and Reset Expression section.
Document Map
A document map is a navigational feature that displays a separate side pane with set of navigational links in hierarchical structure when you view a report. A user can click the content in the list, to navigate to the report page that displays that item. Refer Document Map section to configure document map in the report design.
You can set the static or dynamic text as value for document map property. To set and reset dynamic text, refer Set Expression and Reset Expression section.
Bookmark
Bookmark links allows the users to navigate to different parts of a SSRS report. You can add bookmarks to each textbox, image, table or chart or to the unique group values displayed in a tablix which can direct the users to specified locations in the report. The value of bookmark property can be your own strings or an expression. Refer Bookmark section to configure bookmark in the report design.
You can set the static or dynamic text as value for bookmark property. To set and reset dynamic text, refer Set Expression and Reset Expression section.
Custom attributes
This property can be used to set the values for map custom properties. To create and assign values for custom properties using properties panel refer Custom Properties section.
Tooltip
Tooltip property can be used to display informative text or value, when the user hovers over on the report item in report preview. To set tooltip for table report item using properties panel refer Tooltip section.
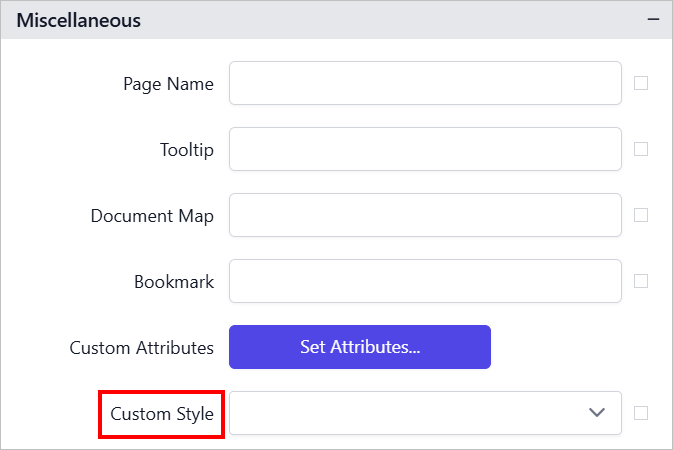
Custom Style
The Custom Style property enables the use of external CSS for styling report items, providing enhanced flexibility beyond the built-in styling options. This property allows you to meet specific design requirements and maintain consistent styling across multiple reports. For a step-by-step guide on setting up custom styles in your report, check the How To section of this guide.
Set expression
An expression can be set to few properties of the map report item to process the property values based on expressions. To set expressions to the map report item properties, refer Set Expression section.
Reset expression
To Reset the expression applied to a property, refer Reset Expression section.
Advanced properties
Few properties of the map report items contains nested properties. To open and handle nested properties, refer Advanced Properties section.
- Basic Settings
- Shapes
- Dataset
- Binding data
- Filter
- Groups
- Appearance
- Border
- Background color
- Projection type
- Title
- Title font
- Position
- Legend
- Spatial
- Shape settings
- Shape color rule
- Marker settings
- Marker color rule
- Marker rule
- Page break
- Break location
- Break Disabled
- Page number reset
- Position
- Data Element
- Visibility
- Miscellaneous
- Page name
- Document Map
- Bookmark
- Custom attributes
- Tooltip
- Custom Style
- Set expression
- Reset expression
- Advanced properties