Integrate the component with Report Server
You can integrate Report Designer with Report Server to create, edit, browse and publish reports using the Report Server built-in API service.
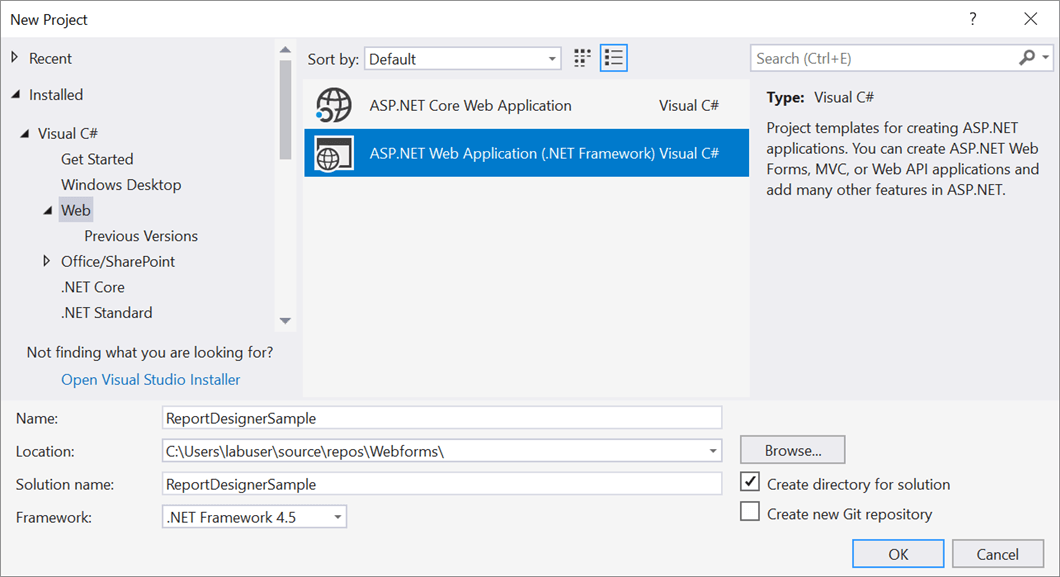
Create ASP.NET Web Forms application
- Open Visual Studio 2017, click the File menu, go to New, and then select Project.
- Go to Installed > Visual C# > Web, and then select the required .NET Framework in the drop-down.
- Select ASP.NET Web Application (.NET Framework), change the application name, and then click OK.
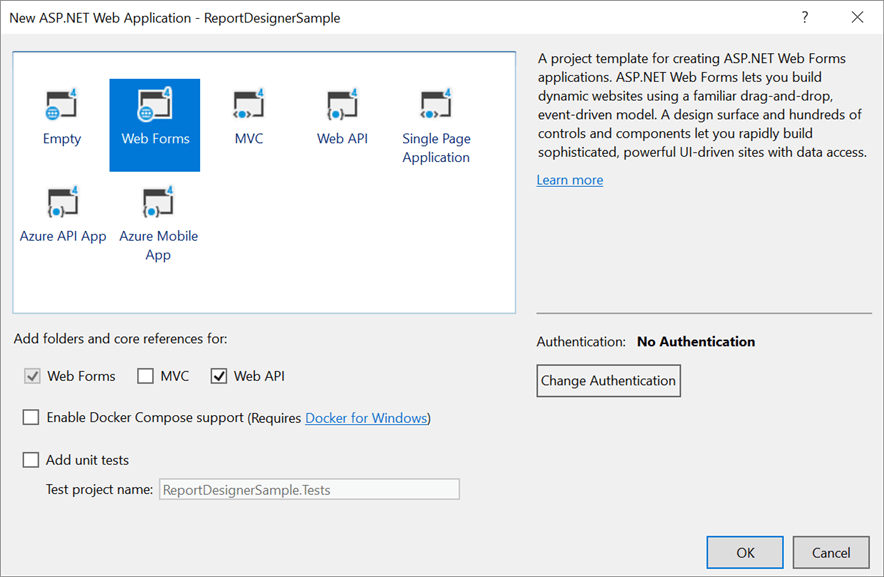
- Then choose the Web Forms in template, enable Web API option in the Add folders and core references for: section.
Add Assembly References
-
Right-click the project or solution in the Solution Explorer tab, and choose Manage NuGet Packages. Alternatively, select the Tools > NuGet Package Manager > Manage NuGet Packages for Solution menu command.
Refer to the NuGet Packages to learn more details about installing and configuring Report Designer NuGet packages.
-
Search for
BoldReports.WebandBoldReports.WebFormsNuGet packages, and install them in your Web Forms application.Package Purpose BoldReports.WebCreates Web API service for processing the reports. BoldReports.WebFormsContains tag helpers to create client-side web Report Designer control. -
Open
Web.configfile and add theBoldReports.WebFormsassembly reference to the<system.web.pages.controls>element withSFtag prefix.<configuration> .... .... <system.web> .... <pages> .... <controls> <add assembly="BoldReports.WebForms" namespace="BoldReports.WebForms" tagPrefix="Bold" /> .... </controls> </pages> </system.web> .... .... </configuration>
Refer Scripts and Styles
Install the BoldReports.JavaScript nuget package into your application.
BoldReports.JavaScript- contains Report Designer scripts and style sheets.
The scripts and styles required for web Report Designer will be added into the Scripts and Content folders of your application.
Refer to the Dependencies to learn more details about web Report Designer dependent scripts and style sheets links.
You can use the following code in the <asp> tag of Default.aspx page.
    <asp:Content ID="BodyContent" ContentPlaceHolderID="MainContent" runat="server">
    <link href="Content/bold-reports/material/bold.reports.all.min.css" rel="stylesheet" />
    <link href="Content/bold-reports/material/bold.reportdesigner.min.css" rel="stylesheet" />
    <link href="Scripts/CodeMirror/lib/codemirror.css" rel="stylesheet" />
    <link href="Scripts/CodeMirror/addon/hint/show-hint.css" rel="stylesheet" />
    <script src="https://cdn.boldreports.com/external/jquery-1.10.2.min.js" type="text/javascript"></script>
    <script src="https://cdn.boldreports.com/external/jsrender.min.js" type="text/javascript"></script>
    <script src="Scripts/CodeMirror/lib/codemirror.js"></script>
    <script src="Scripts/CodeMirror/addon/hint/show-hint.js"></script>
    <script src="Scripts/CodeMirror/addon/hint/sql-hint.js"></script>
    <script src="Scripts/CodeMirror/mode/sql/sql.js"></script>
    <script src="Scripts/CodeMirror/mode/vb/vb.js"></script>
    <!--Render the gauge item. Add this script only if your report contains the gauge report item. -->
    <script src="Scripts/bold-reports/common/ej2-base.min.js"></script>
    <script src="Scripts/bold-reports/common/ej2-data.min.js"></script>
    <script src="Scripts/bold-reports/common/ej2-pdf-export.min.js"></script>
    <script src="Scripts/bold-reports/common/ej2-svg-base.min.js"></script>
    <script src="Scripts/bold-reports/data-visualization/ej2-circulargauge.min.js"></script>
    <script src="Scripts/bold-reports/data-visualization/ej2-lineargauge.min.js"></script>
    <!--Render the map item. Add this script only if your report contains the map report item.-->
    <script src="Scripts/bold-reports/data-visualization/ej2-maps.min.js"></script>
    <script src="Scripts/bold-reports/common/bold.reports.common.min.js"></script>
    <script src="Scripts/bold-reports/common/bold.reports.widgets.min.js"></script>
    <script src="Scripts/bold-reports/common/bold.report-designer-widgets.min.js"></script>
    <!--Chart component script added before the web report designer script to render chart report item in reports-->
    <script src="Scripts/bold-reports/data-visualization/ej.chart.min.js"></script>
    <!-- Report Viewer component script-->
    <script src="Scripts/bold-reports/bold.report-viewer.min.js"></script>
    <!-- Report Designer component script-->
    <script src="Scripts/bold-reports/bold.report-designer.min.js"></script>
    </asp:Content>
To learn more about rendering a report with data visualization report items, refer to the how to render data visualization report items section.
Add Control in ASPX Page
Initialize the web Report Designer as shown in the following code sample in the Default.aspx page.
<asp:Content ID="BodyContent" ContentPlaceHolderID="MainContent" runat="server">
    <link href="Content/bold-reports/material/bold.reports.all.min.css" rel="stylesheet" />
    <link href="Content/bold-reports/material/bold.reportdesigner.min.css" rel="stylesheet" />
    <link href="Scripts/CodeMirror/lib/codemirror.css" rel="stylesheet" />
    <link href="Scripts/CodeMirror/addon/hint/show-hint.css" rel="stylesheet" />
    <script src="https://cdn.boldreports.com/external/jquery-1.10.2.min.js" type="text/javascript"></script>
    <script src="https://cdn.boldreports.com/external/jsrender.min.js" type="text/javascript"></script>
    <script src="Scripts/CodeMirror/lib/codemirror.js"></script>
    <script src="Scripts/CodeMirror/addon/hint/show-hint.js"></script>
    <script src="Scripts/CodeMirror/addon/hint/sql-hint.js"></script>
    <script src="Scripts/CodeMirror/mode/sql/sql.js"></script>
    <script src="Scripts/CodeMirror/mode/vb/vb.js"></script>
    <!--Render the gauge item. Add this script only if your report contains the gauge report item. -->
    <script src="Scripts/bold-reports/common/ej2-base.min.js"></script>
    <script src="Scripts/bold-reports/common/ej2-data.min.js"></script>
    <script src="Scripts/bold-reports/common/ej2-pdf-export.min.js"></script>
    <script src="Scripts/bold-reports/common/ej2-svg-base.min.js"></script>
    <script src="Scripts/bold-reports/data-visualization/ej2-circulargauge.min.js"></script>
    <script src="Scripts/bold-reports/data-visualization/ej2-lineargauge.min.js"></script>
     <!--Render the map item. Add this script only if your report contains the map report item.-->
    <script src="Scripts/bold-reports/data-visualization/ej2-maps.min.js"></script>
    <script src="Scripts/bold-reports/common/bold.reports.common.min.js"></script>
    <script src="Scripts/bold-reports/common/bold.reports.widgets.min.js"></script>
    <script src="Scripts/bold-reports/common/bold.report-designer-widgets.min.js"></script>
    <!--Chart component script added before the web report designer script to render chart report item in reports-->
    <script src="Scripts/bold-reports/data-visualization/ej.chart.min.js"></script>
    <!-- Report Viewer component script-->
    <script src="Scripts/bold-reports/bold.report-viewer.min.js"></script>
    <!-- Report Designer component script-->
    <script src="Scripts/bold-reports/bold.report-designer.min.js"></script>
    <div style="height: 650px;width: 950px">
    <Bold:ReportDesigner runat="server" ID="designer"></Bold:ReportDesigner>
    </div>
</asp:Content>
Report Server Configuration to design the report
-
The Report Designer requires the
serviceAuthorizationToken,serviceUrlandreportServerUrlto perform the API actions with Bold Report Server. You can provide the information from report server as like explained below, -
serviceUrl– Report Server Reporting Service information should be provided for this API. -
serviceAuthorizationToken– Authorization token to communicate with reportServiceUrl. -
reportServerUrl- Report Server Reporting Server information should be provided for this API.
You can follow one of the procedure from below based on your Report Server type,
Enterprise Reporting Server
-
Generate token with your user credentials and assign it to serviceAuthorizationToken. You can refer to the documentation here, to generate the token by using credentials.
<div style="height: 650px;width: 950px">
    <Bold:ReportDesigner runat="server" ID="designer"
    ServiceAuthorizationToken="bearer <server token>" >
    </Bold:ReportDesigner>
</div>
You can refer to the documentation here on how to generate the token within an application.
-
Set the Bold Report Server built-in service URL to the
ServiceUrlproperty. TheServiceUrlproperty value should be in format ofhttps://<<Report server name>>/reporting/reportservice/api/Designer.<div style="height: 650px;width: 950px"> <Bold:ReportDesigner runat="server" ID="designer" ServiceUrl="https://on-premise-demo.boldreports.com/reporting/reportservice/api/Designer" ServiceAuthorizationToken="bearer <server token>" > </Bold:ReportDesigner> </div> -
Set the Bold Report Server built-in server URL to the
ReportServerUrlproperty. TheReportServerUrlproperty value should be in format ofhttps://<<Report server name>>/reporting/api/site/<<site name>>.<div style="height: 650px;width: 950px"> <Bold:ReportDesigner runat="server" ID="designer" ServiceUrl="https://on-premise-demo.boldreports.com/reporting/reportservice/api/Designer" ReportServerUrl="https://on-premise-demo.boldreports.com/reporting/api/site/site1" ServiceAuthorizationToken="bearer <server token>" > </Bold:ReportDesigner> </div>
Cloud Reporting server
-
Generate token with your user credentials and assign it to serviceAuthorizationToken. You can refer the documentation here, to generate the token by using credentials.
<div style="height: 650px;width: 950px">
    <Bold:ReportDesigner runat="server" ID="designer"
    ServiceAuthorizationToken="bearer <server token>" >
    </Bold:ReportDesigner>
</div>
You can refer to the documentation here on how to generate the token within an application.
-
Set the Bold Report Server built-in service URL to the
ServiceUrlproperty. TheServiceUrlproperty value is ahttps://service.boldreports.com/api/Designer.<div style="height: 650px;width: 950px"> <Bold:ReportDesigner runat="server" ID="designer" ServiceUrl="https://service.boldreports.com/api/Designer" ServiceAuthorizationToken="bearer <server token>" > </Bold:ReportDesigner> </div> -
Set the Bold Report Server built-in server URL to the
ReportServerUrlproperty. TheReportServerUrlproperty value should be in format ofhttps://<<Report server name>>/reporting/api/.<div style="height: 650px;width: 950px"> <Bold:ReportDesigner runat="server" ID="designer" ServiceUrl="https://service.boldreports.com/api/Designer" ReportServerUrl="https://acmecorp.boldreports.com/reporting/api" ServiceAuthorizationToken="bearer <server token>" > </Bold:ReportDesigner> </div>